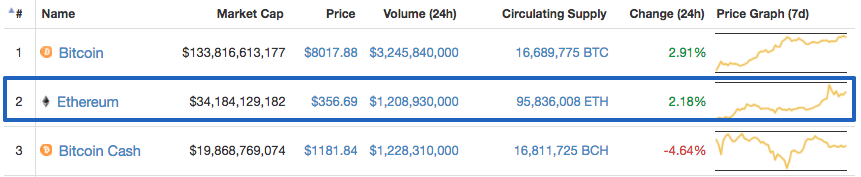
With a week-long bull, Ethereum value skyrocketed, and the market cap of this coin shot up and reached above $34 million. Though a billion short of becoming the number one coin, Ethereum is dominating the second spot. The last 24-hour trading volume with over $120 million is great, but Bitcoin Cash surpassed that with a 24-hour trading volume of over $122 million.
Key Highlights:
- ETH/USD pair appreciated 21 percent week-on-week and also achieved a weekly peak of $370
- A daily resistance level is checking the pair to rise any further, but the excellent support of a trend line is also preventing the pair to take a dip
- ETH/BTC dropped 12 percent weekly and currently trading around 0.044 BTC
In the weekly chart, Ethereum had a steady and gradual upward rise. The week started with an upward boost, and the value of the coin reached $337 from $297. This 13.5 percent gain is achieved in mere three days. But then the coin had a stagnation primarily due to a resistance at $332 to $335. Also, support at $322 to $324 kept the value afloat.
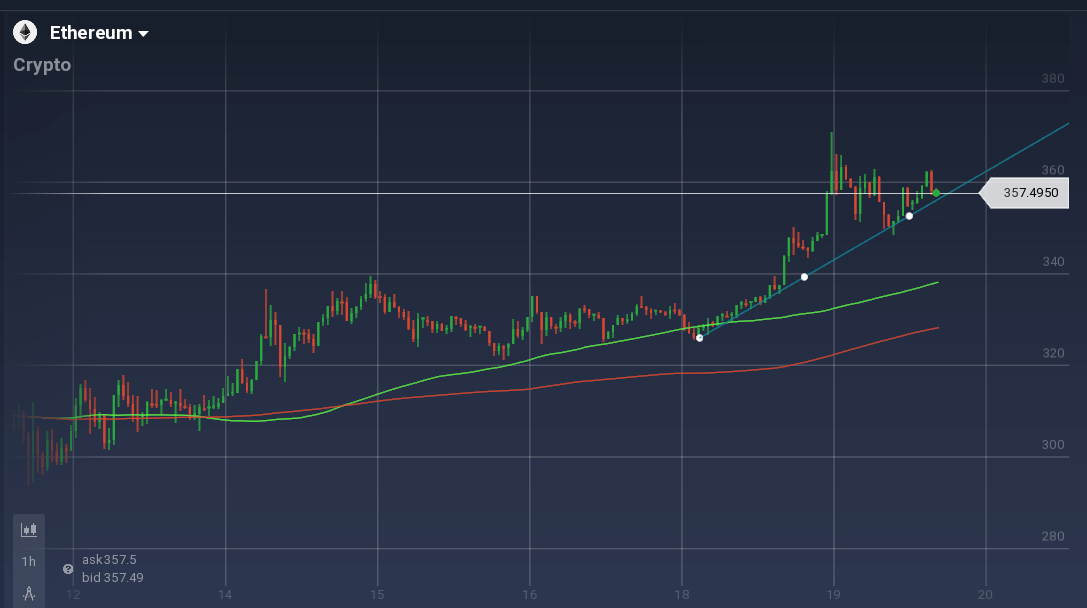
In the last 48 hours, ETH/USD pair had another steep upward boost, and the pair reached its weekly peak at $370. But due to resistance, the value quickly dropped from that point. In the daily chart, the coin is facing a significant resistance at $$363.5 to $364, but the tend line also acts as a great support. With a daily gain of 2 percent, the coin is currently trading around $356.
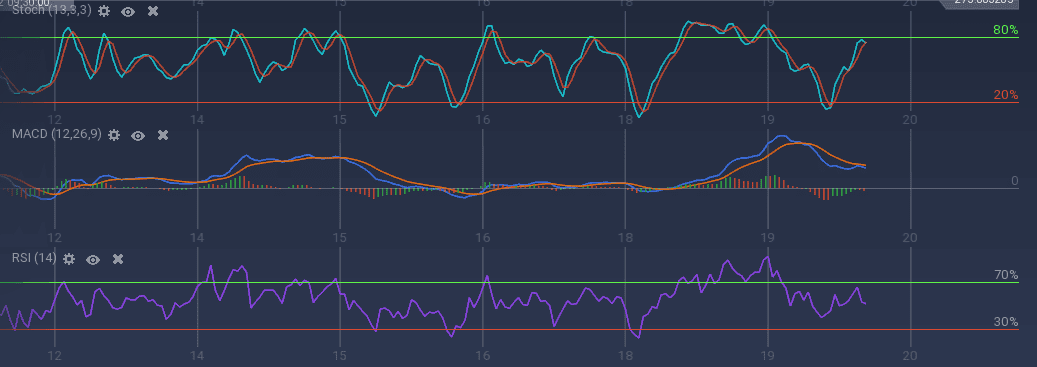
Due to the resistance on the daily chart, the oscillators are indicating a bearish movement. Stoch is moving upward but is recently taking a downward turn near the overbuying mark. The daily resistance also forced the MACD to run bearish, but the gap between the curves also diminished significantly because of the trend support. 100 SMA is still above 200SMA indicating an upward least resistance.
ETH/BTC pair started the week with an upward boost, but soon the bullish Bitcoin resulted in a drop in the value of the ETH/BTC pair. After a decline to 0.041 BTC, the bullish ETH/USD also provided support, and the ETH/BTC pair is also recovering since. Currently, the pair is trading at 0.044 BTC.