Since the start of this month, Ethereum Classic saw a huge dip in its value. In 10 days, its value when down from above $13 to as low as $11, that’s an 18% dip. But since then ETC gained the momentum again and showed a strong upward trend in the past 7 days. Last week, it gained 10% of its value and is now trading around $11.9 with a buying surge.
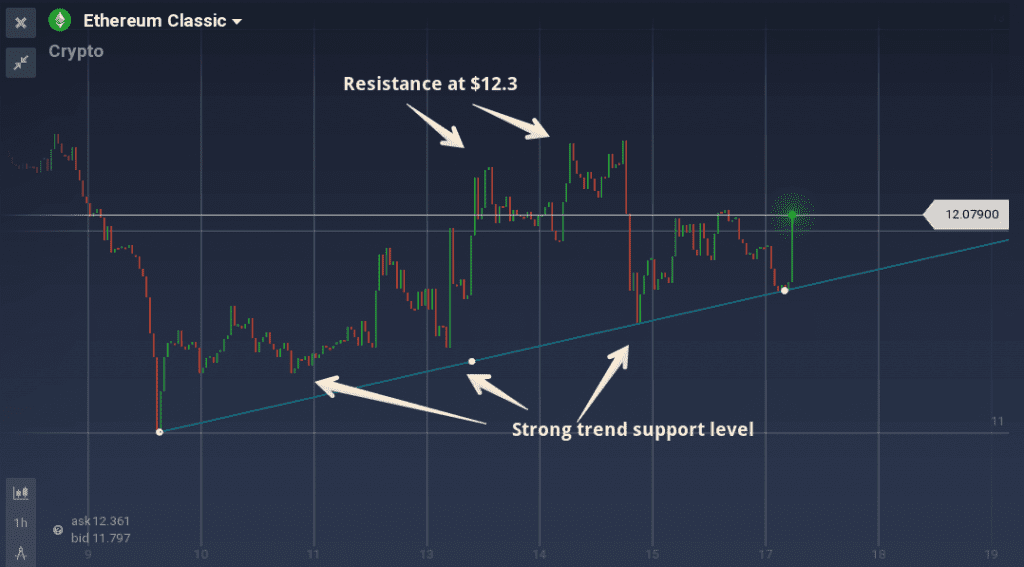
7-day chart of ETC/USD shows an upward trend and the trendline support is very strong. Though the value crossed the $12 mark, its find it had to hold because of the resistance around $12.3.
Key Highlights
- ETC/USD followed a strong upward moving trendind throughout the week.
- ETC/USD gained 10% week-on-week and above 5% in the last 24 hours
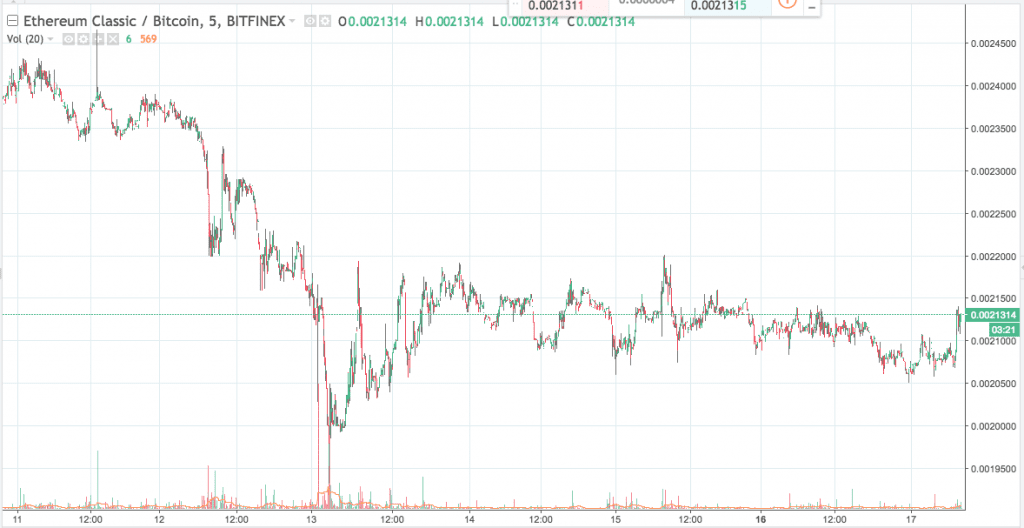
- Against BTC, ETC is fluctuating around 0.0021BTC

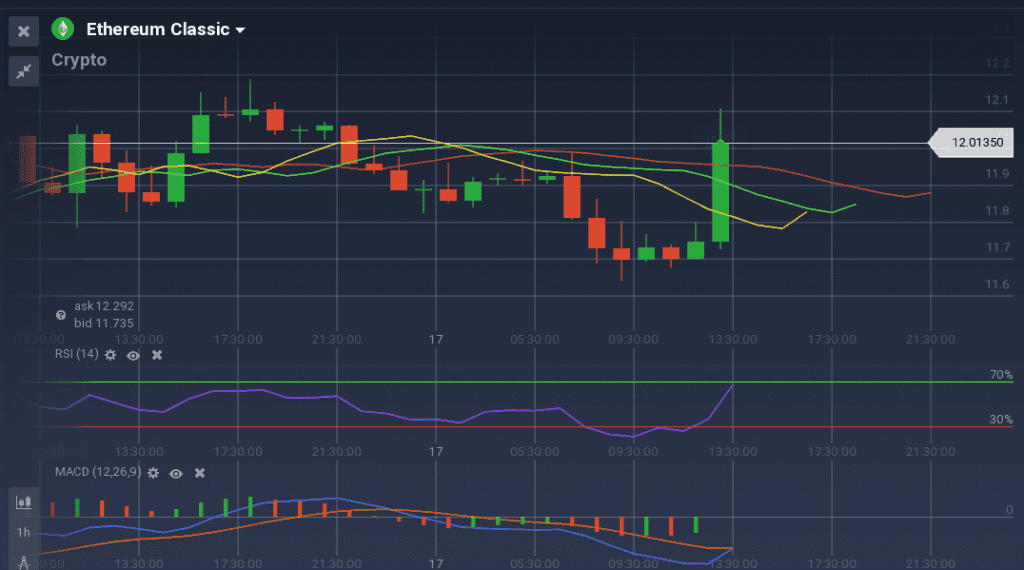
If we focus on the daily chart, ETC had a downward trend against USD. But last 2 candle stick shows that it regained the buyer’s confidence and the downward trend is shifting. This can be clearly verified from the Alligator tool and the MACD graphs. The70/30 RSI also went up to 61% after staying below the oversell line for some time. But because of the strong weekly gaining trend, over buying of ETC will probably not occur.

Against the BTC, Ethereum Classic is trading around 0.002BTC. Because the rising BTC/USD, in the early week, value of ETC against BTC dropped 0.0023BTC to 0.0020BTC. But then the value stabilized and is fluctuating around 0.0021BTC mark.

Overall, the buyers are gaining their trust on this coin and the weekly upward trend is very likely to follow in the coming days.

