
The EOS network is live after a successful Main Net launch! Now we can expect to see increased interest around this crypto currency currently valued at close to 10 USD.
The big picture
Opinions differ from trader to trader so maybe there are people who view the Main Net launch as bearish, but I beg to differ. At the very least there will be some volatility but longer term the outlook is very bullish. The EOSIO public blockchain is live and according to Block.one developers are already building revolutionary dApps on top of it. From a “fundamental” point of view the underlying blockchain has value and the coin itself is likely to surge.
Deciphering the technical chart
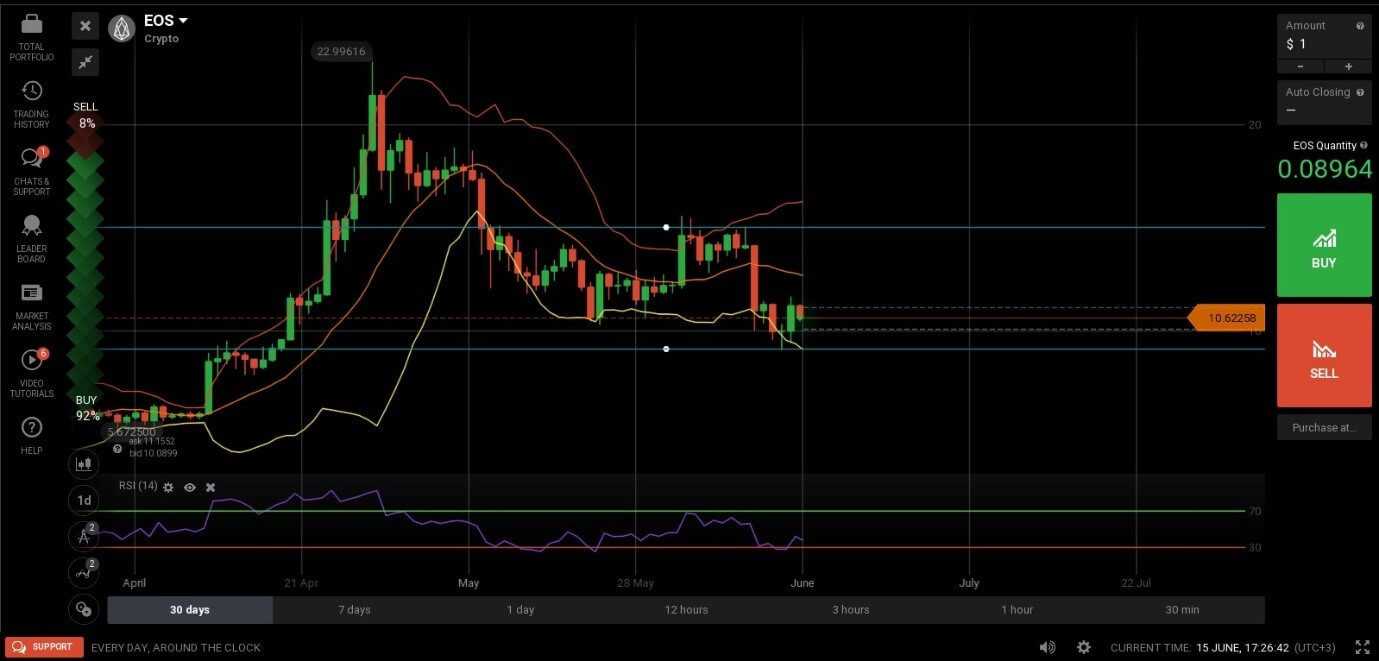
On the daily chart (top picture) the EOS/USD pair is sitting at the bottom of the Bollinger Band channel and the bands are spreading out, showing nice volatility. This is a bullish sign that, when coupled with the EOSIO blockchain launch, could generate a rise in prices.

On the lower time frame chart (4H, second picture), we can see a strong climb that started around $9.00. This level will act as strong support in the future, but we also have a resistance around $11.60 at a previous top. If this resistance is broken we can expect a climb into the next handle at $12.90, which was previous resistance (first touch on the chart), turned support and possibly resistance again.
Support zones: $9.00 (previous low) – $10.00 (psychological level)
Resistance zones: $11.60 followed by $12.90
Most likely scenario: Break of first resistance and a move into the next level
Alternate scenario: ranging movement until the market decides whether the EOSIO launch is going well or not
Bitcoin drops to test the yearly low. Recovery underway
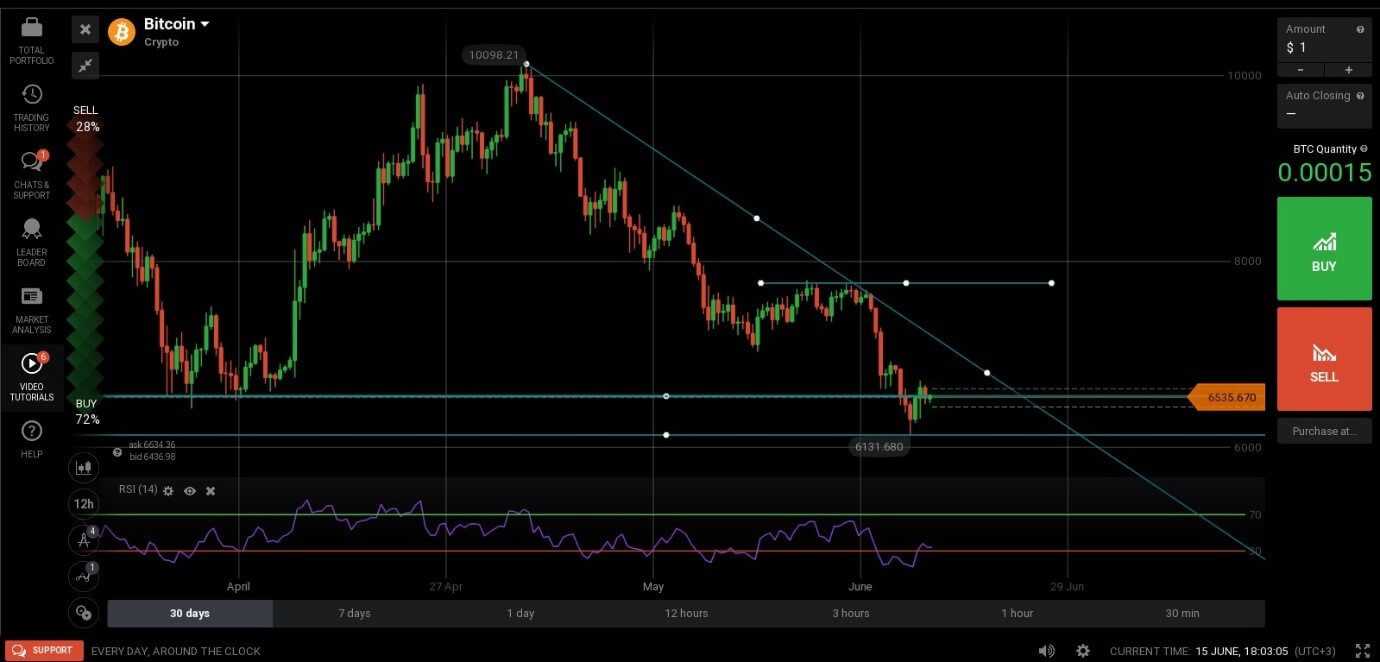
The No 1 cryptocurrency dropped to a low of $6,131, approaching the year’s low at $5,922 but soon regained $6,500 levels. This may be the beginning of a stronger climb because we clearly see market participants are interested in buying Bitcoin at a discounted price.
Deciphering the technical chart
The pair remains bearish as we are clearly seeing lower lows and lower highs, but at the same time the cheap price is becoming appealing to more and more investors and this is likely to bring it higher. Currently Bitcoin is hovering around an area that was previously support ($6,400 – $6,700) and the way it behaves here will determine the next short to medium direction: a move above the zone will probably generate an extended period of increase, at least into the bearish trend line seen on the chart above. On the other hand, if the mentioned zone turns into resistance, we will probably see a move into this year’s low at $5,922.
Support zones: $6,131 (most recent low) followed by $5,922
Resistance zones: current zone $6,400 – $6,700
Most likely scenario: small climb, capped by the bearish trend line
Alternate scenario: touch of previous low $6.131
