After a period of slow yet steady growth, observed since September 22nd, the cryptocurrency market has abruptly lost a considerable portion of its value, depreciating from $143 billion to $137 billion on September 28th in a matter of only two hours. Is it a beginning of a new negative trend or merely a short-term retraction?

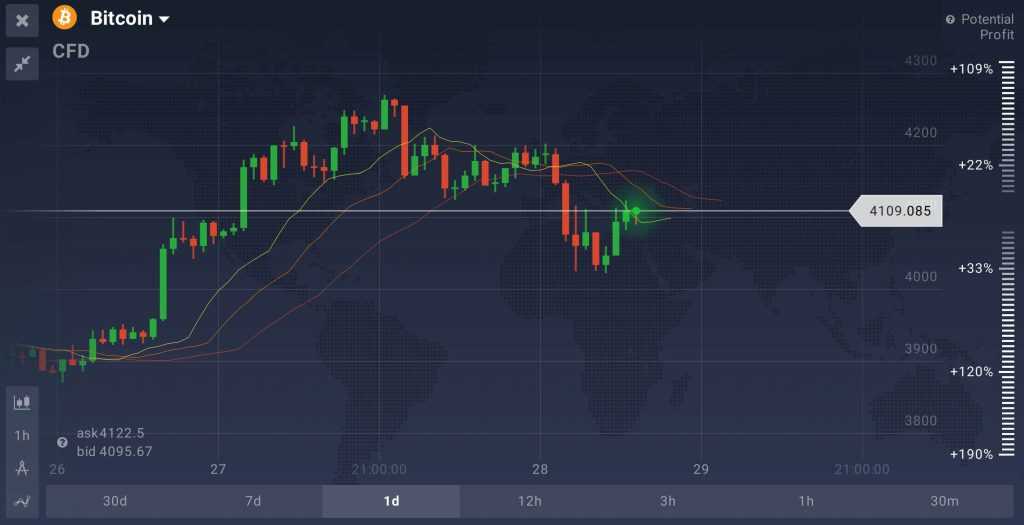
Traded at around $4200 before the plunge, Bitcoin depreciated to $4040 only to recover to $4124 several hours later. The nosedive did not affect the market confidence in BTC and its future prospects, as BTC trading was given the green lite by the Japanese and European authorities. According to the Alligator technical analysis tool, the future of Bitcoin is unclear. Demonstrating no particular short-term trend, the indicator hints at a possibility of both upward and downward mobility. Judging by the Bollinger Bands, an indicator that is good at determining calm and volatile periods, Bitcoin is currently in its volatile phase. Where should it go is yet to be seen.

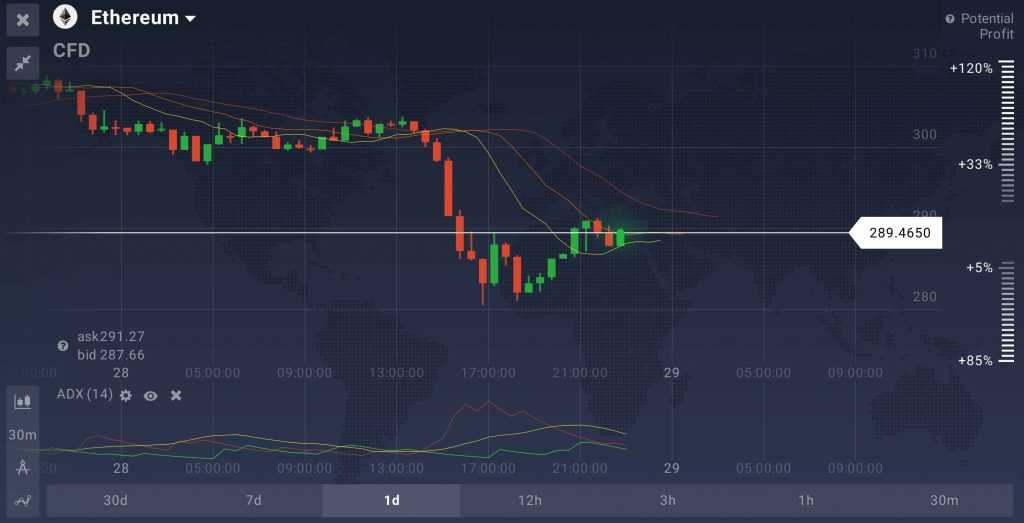
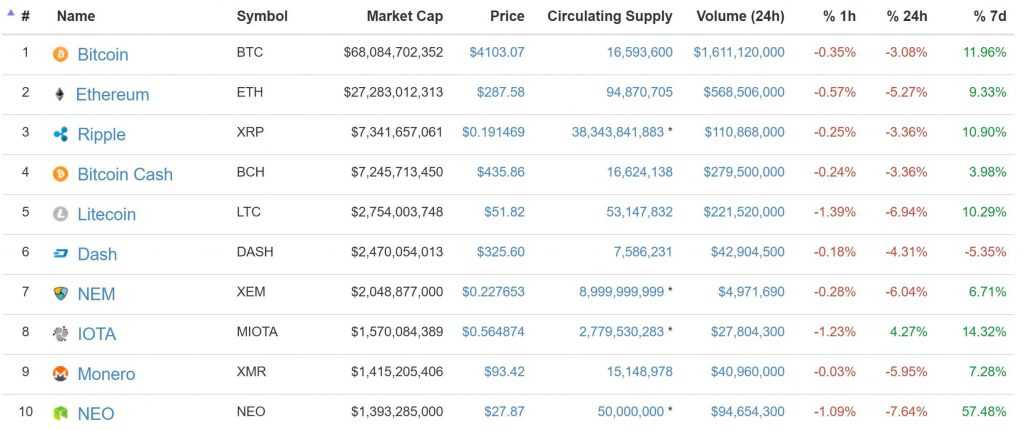
Unlike its elder counterpart, Ethereum was not as good at recovering after an abrupt plunge. The cryptocurrency depreciated from $303 to $282. It later retracted to $290 but a slight negative movement can still be observed. The short-term ETH trend is negative as displayed by the Alligator and ADX. Most major cryptocurrencies demonstrated limited downward movement for a short period of time. Out of top-ten cryptocurrencies by market capitalization, only IOTA has demonstrated single digit growth over the course of 24 hours. The rest do remain in the red.

How does one differentiate between a correction and a new trend? A correction (sometimes also called a retraction) is a part of a larger trend. Usually it is a short-term contra-directional price movement. If the trend is bullish, it will most certainly shrink from time to time but still demonstrate positive long-term dynamics. The emergence of a new trend cannot always be predicted adequately as it takes some time for a tendency to settle. However, if the contra-directional movement persist and, more than that, local maxima/minima can no longer reach the values observed in the recent past, the new trend can be observed.

