
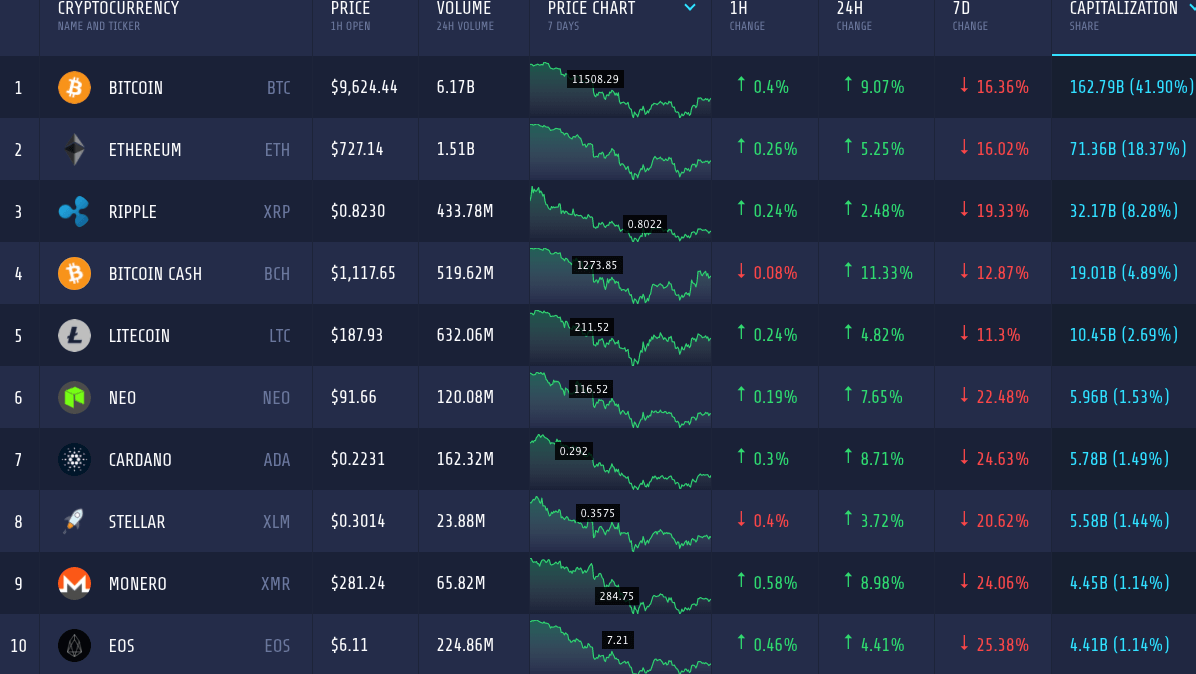
After a huge setback, the cryptocurrency market is on the rise again. Coins are adding aggressively to their value since the last 24 hours, many in double digits. The total market cap of the coins has reached to $388 billion, compared to mere $354 a couple of days back.
DASH
DASH, one of the popular private coins in the market, is one of the leading gainers in the weekend price rebound. The coin gained 11 percent in the last 24 hours of trading and is maintaining the upward momentum. But due to the dominance of the bear all along the week except recently, the coin depreciated by 14 percent. DASH holds $4.22 billion in market capitalization and is the 11th largest coin in the market.

On the weekly chart, DASH maintained a long-running bearish pace till the weekend trading started. The coin went down from $621 to below $440 with the bearish trend. Though support at $500 tried to hold the falling value, it was not successful. After the rebound of the price in the weekend trading, DASH faced another massive resistance at $524, which resulted in a classic pullback until it found support at $468. The support acted as a pivot and the coin is on the rise again, but is facing some resistance above $540.
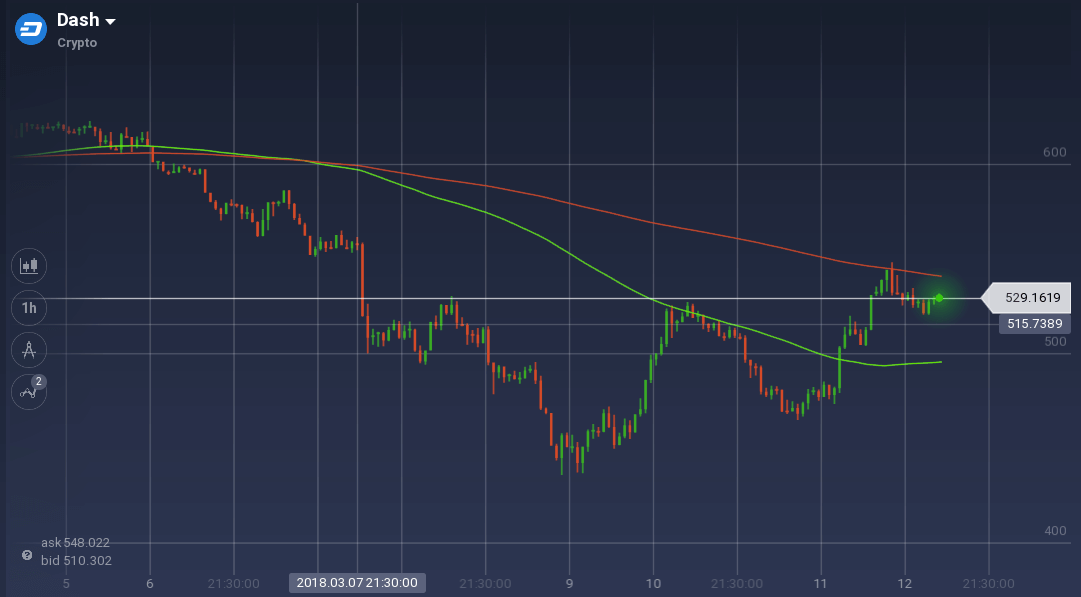
Due to the presence of resistance along with the bullish momentum, the technical indicators are indicating mixed signals. Stoch, along with MACD, is signaling bearish signs as the former is running aggressively towards the bottom. However, RSI, being at 60 percent, has an upward inclination. The price curve also tends to have a support around 23.6 percent Fibonacci level.
Tron
Tron is another coin which is rebounding aggressively after the market dip. The coin added 10.5 percent on the daily chart, but has lost more than 18 percent on the weekly. With $265 million in trading volume, it is one of the popular coins among the traders. It holds $2.5 billion in market cap.
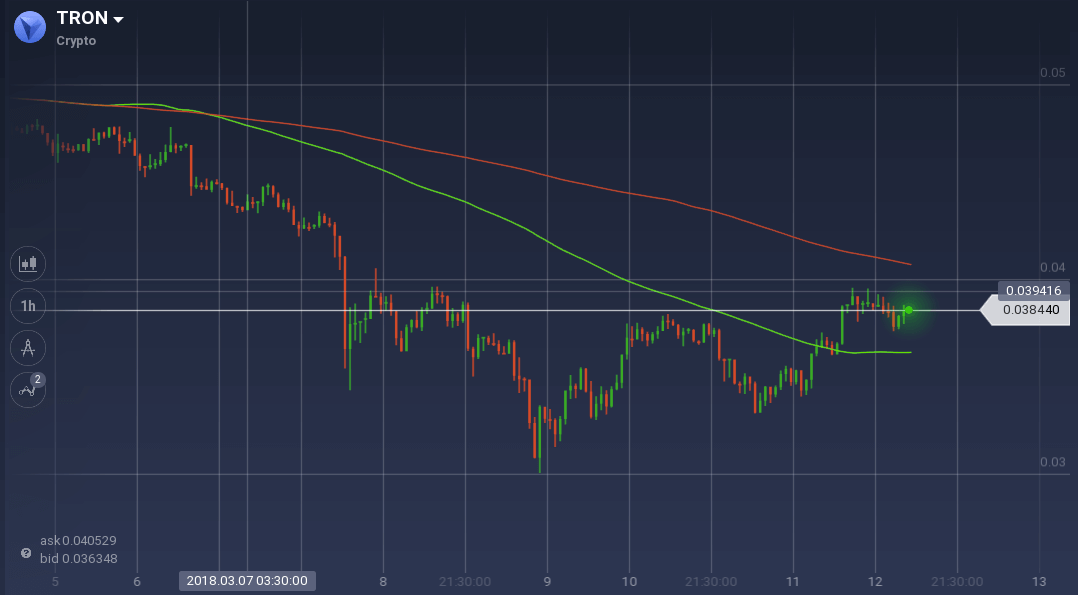
Tron initiated the week with a tremendous dominance of the bear. The coin fell from $0.047 to $0.030 till the midweek. Though $0.036 tried to form a support in the mid-bearish run, resistance at $0.039 pushed the coin further down. After the rebound, the coin faced another stiff resistance level at $0.037. After a short downward trip, the coin rebounded again with support at $0.033. Currently, DASH is facing resistance again at $0.039, but the coin is testing the level over and over.
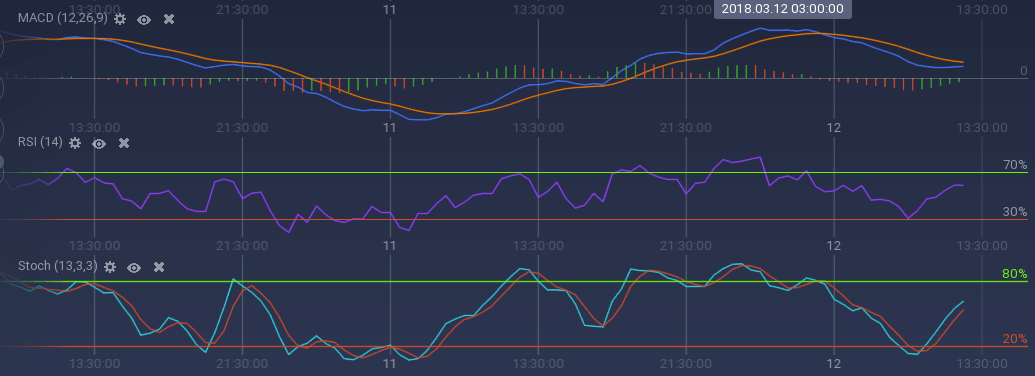
Despite the presence of resistance, the technical indicators are signaling upward bound movement. Stoch is going upward with a steep inclination and so is the RSI. Currently, the value of RSI is at 60 percent. MACD is also signaling a bullish move. However, due to the dominance of the bearish trend in the weekly chart, 100 SMA is still running below 200 SMA.
Conclusion
Based on the historical trend, it is very likely that the market will continue the bull for a while. However, it will need a booster to gain it apex values.
