
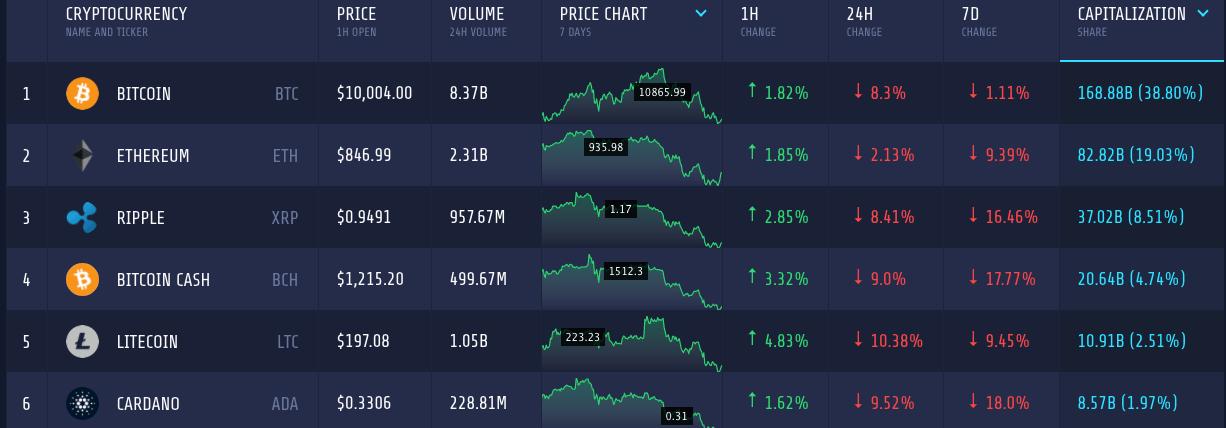
Cryptocurrencies have again taken a downturn. As the chart turns red again, the total market cap slipped to $435 billion – the market lost $30 billion in 24 hours. However, there are signs of recovery in the recent hours.
Bitcoin
After dipping below $6000 a couple of weeks back, Bitcoin has rebounded aggressively and went above $11700. However, with a recent dominating bear, the coin slipped below $10,000. The market leader still holds above 38 percent of the entire market cap with more than $168 billion. The trading volume also spiked with the volatility and in the last 24 hours, it was recorded at $8.3 billion.
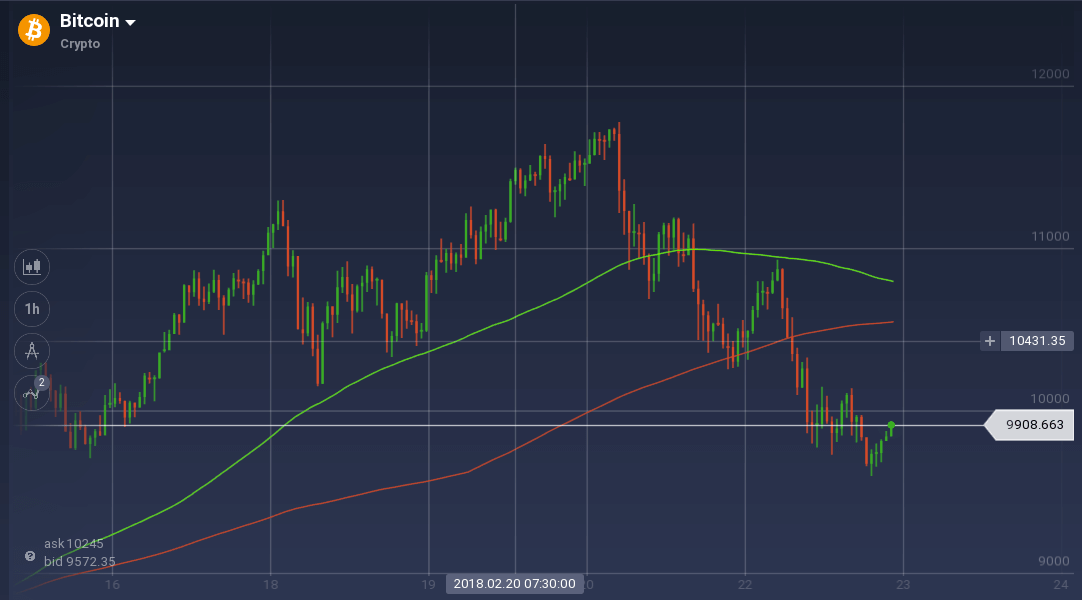
On the weekly chart, Bitcoin had a good start. It maintained a bull to reach $11,300 from $9,800 in the first 48 hours. Though there was a pullback, support at $10,400 acted as a pivot and initiated a bullish run. In little more than 24 hours, the coin reached above $11,700, but then the bear took over the market. The coin took a dive and went below $11,000. Though a support around $10,900 tried to check the dip, it dived further. Along the way, multiple levels – $10,300 and $9,800 – tried to form strong support, but the bearish trend was too strong to put any check.
Recently, after dipping below $9,600, the coin is trying to rebound and is trading around $9,900.
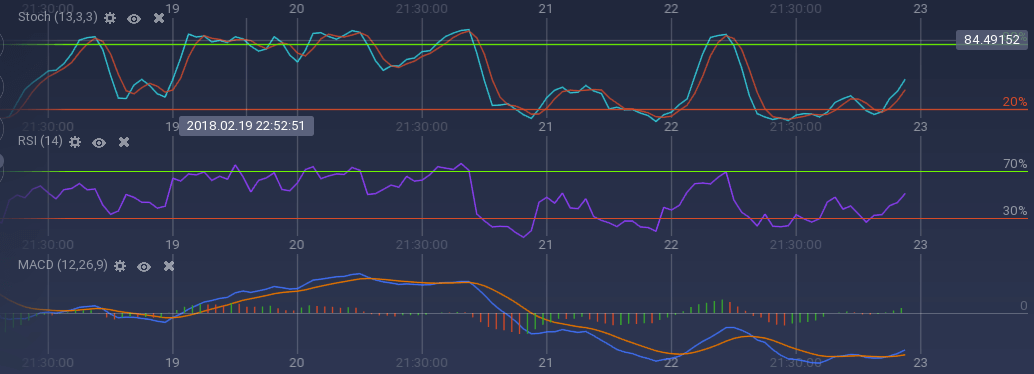
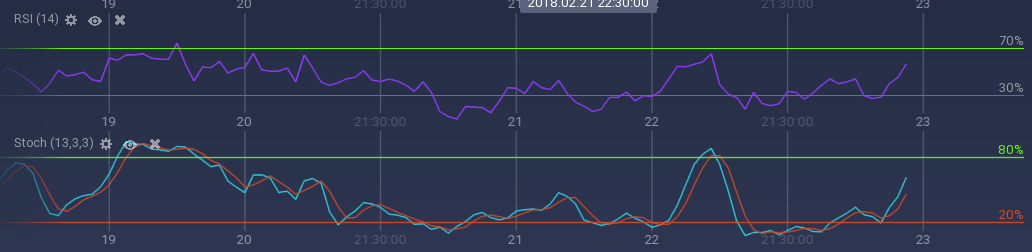
As the coin is going up, the technical indicators are picking up the upward pace. Stoch and RSI both are in an upward sprint. RSI is currently at 53 percent- an optimum level. MACD is also signaling strong bullish pace after running dull for a while. However, with the dominant bear, the gap between 100 SMA and 200 SMA is shrinking, even though the former is running on the top.
Bitcoin Cash
Bitcoin Cash is also running dull. No matter how much the promoters try to make it mainstream, the coin is not immune to the volatile market dynamics of the cryptocurrency market. Against USD, BCH dipped 9 percent on the daily chart, thus depreciating more than 17 percent in 7 days. With $20 billion in market cap, the coin firmly holds the 4th spot in the list of largest cryptocurrencies.
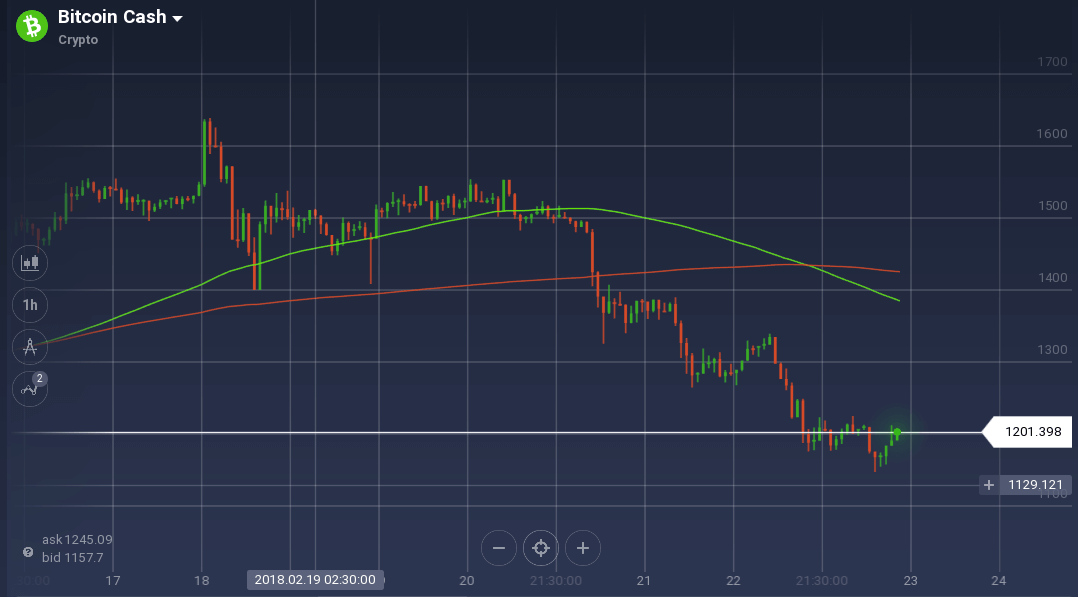
Unlike Bitcoin, BCH the resistance at $1550 dominated the weekly chart. BCH was traded below the resistance level except at a point when it spiked to $1636. However, multiple support – $1509, $1455 and $1500 – till the midweek prevented any steep dip.
The support could not hold the bearish take over of the market and the coin started to bleed. With an attempt to form support at $1359, $1273 and $1180, the coin went below $1150 from $1490 in mere 48 hours. But again, with a tendency to recover some of its lost value, BCH is gaining an upward pace.
The oscillators are signaling positive movement of the coin is trying to recover. Stoch is soaring with a bullish momentum, so is RSI with its current value at 58 percent. However, 100 SMA went below 200 SMA with a recent crossover.
Market Update
In the US, Robinhood started its feeless service for crypto trading in selected states. This might attract a large number of the crowd towards the market, considering the over-enthusiasm among the public while registering for the platform.
The Venezuelan state-sponsored cryptocurrency took off well in the market as it raised $735 million in the pre-sale. However, the US Treasury Department issued a fresh warning to the crypto investors reminding them that the US government has imposed sanctions on Venezuela.
Conclusion
As the market is going down frequently, it might be a great opportunity for the traders to earn profits by short selling cryptos.
