
For a couple of months now Bitcoin has been showing record low volatility and the lack of momentum leaves crypto traders in tension, waiting for signs of a new rapid movement of the first cryptocurrency. The overall hype around Bitcoin has gone down, but what if the current uncertainty results in a strong upward trend? Or will the crypto price fall? Currently Bitcoin is traded at $9 300, but sooner or later a flat dynamic might turn into a trend or the opposite. Read the full article for a technical analysis of Bitcoin and make up your mind about it.
What is going on with Bitcoin?
Since its low of $3 800 in the end of March, Bitcoin made it to $10 000 in two months (around the 1st of June) and has been fluctuating between $8 500 and $10 000 ever since. June and July were months of uncertainty and there are multiple forecasts with traders waiting for Bitcoin to break the support or resistance levels.
The previous trend was positive and Bitcoin doubled in price, could the current consolidation result in the growth of the asset? The overall positive tone of the stock market might create the basis for it, but it is not set in stone.
How to trade Bitcoin?
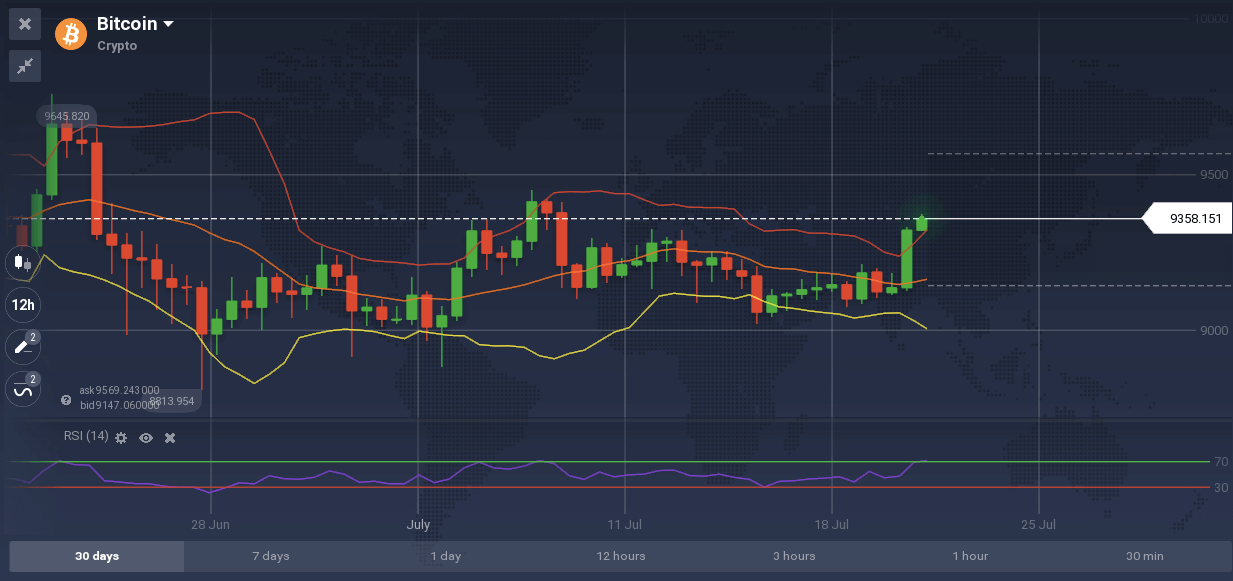
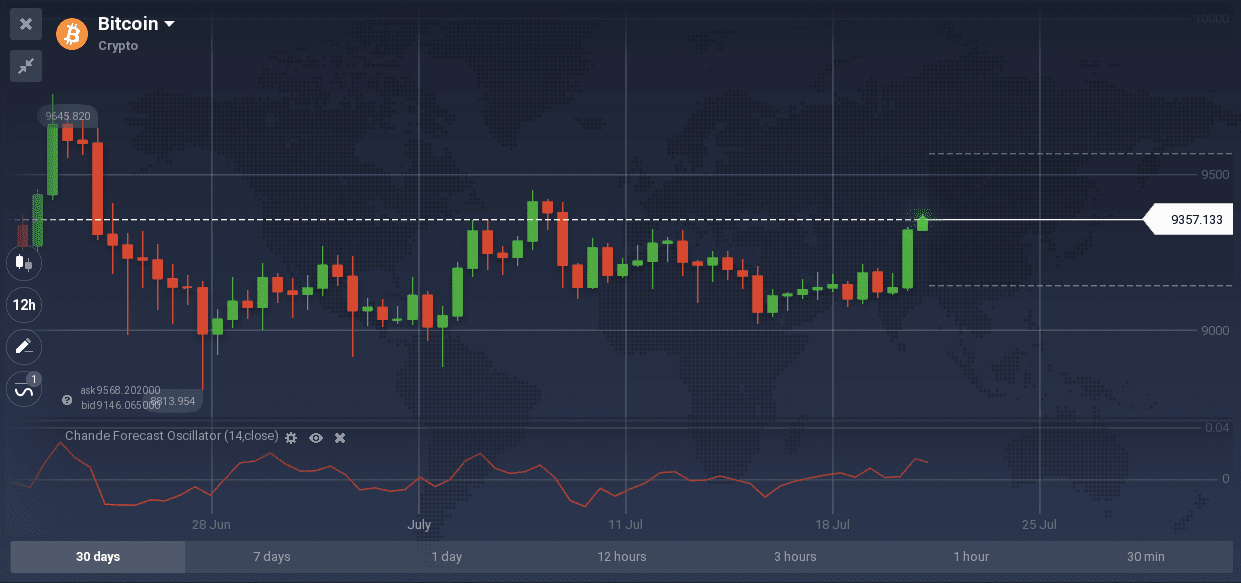
The recent growth of Bitcoin created many trading opportunities for crypto traders and the current events may result in even more potential chances. Let’s turn to technical indicators and see what they have to offer. For all indicators, examples of a price chart for 30 days with candles of 12h interval are being used.
RSI + Bollinger Bands
First on the list: a popular combination of RSI and Bollinger Bands. Bollinger Bands show that the asset has crossed the upper band and currently moves upwards, while RSI gives a signal that the asset is overbought. This could mean that the starting positive trend may reverse and turn into a diminishing one, as asset prices do not normally stay long in the overbought or oversold areas.
Chande Forecast Oscillator
This momentum indicator may be used on its own to potentially predict the future price direction. As it is obvious from the chart, the indicator was showing price growth for some time, but now it could possibly reverse and drop below the 0 value of the indicator. Only time can tell what will actually happen.
ADX
ADX shows a bullish crossover with the trend strength slowly rising (the ADX line crossed the 20 value and tends up). Does this mean that Bitcoin could potentially gain momentum and break through the resistance level at $10 000 – $10 300?
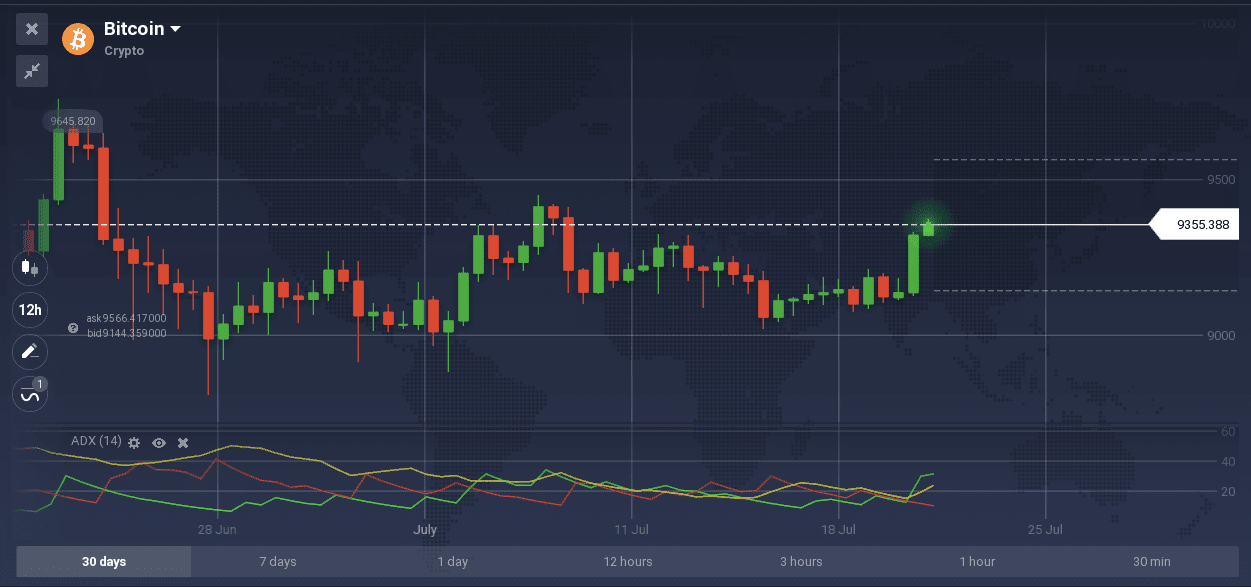
Though ADX shows a positive trend, other indicators point out the possible drop in price. Even with the current drop in volatility, BTC stays one of the most traded assets and there is no doubt that soon the asset will surprise everyone with new records. Of course, it is important to study the market well before entering it and checking the signals with other indicators might be a good practice.
Finally, it is always important to note that past performance is not an indicator of future performance. It is important to remember that no indicator shows 100% accurate signals and that divergences may happen.
