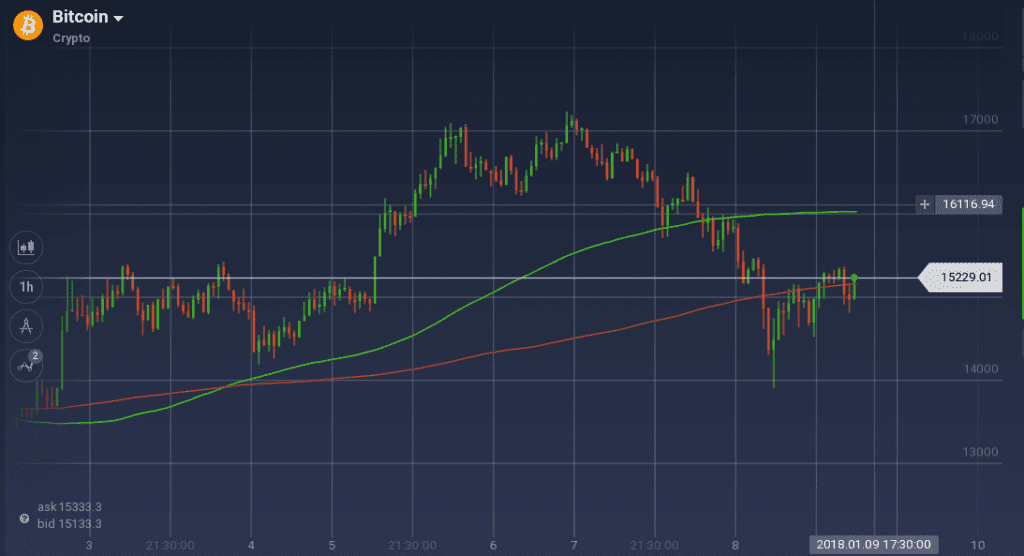
The past week was rough for the crypto market leader. After a bullish rally, a bearish run dominated this week’s chart. Still, Bitcoin holds above $255 billion in market cap and there seems to have no decrease in the trading of this coin as in the past 24 hours, over $18.5 billion in trading volume was recorded.
Key Highlights
- The resistance above $17,200 was very strong and the coin could not breach it even after testing it for a couple of times
- The coin is currently testing the resistance at $15,300, which if breached might give it an upward boost
Technical Analysis
In the weekly chart, Bitcoin started with an upward jump as it went up from $13,600 to $15,300. The coin had to face resistance at $15,300 which it ultimately breached to cross $17,000. But stiff resistance at $17,200 ceased any further growth and also pushed the price downward. This initiated a long bearish rally.
Bitcoin dropped below $14,000 before it could recover. Finally, BTC/USD pair found some support around $14,500 and started to recover. But the pair is also facing new resistance at $15,350.

Because of the recovery from previous weeks dip, the 100 SMA went above the 200 SMA, indicating an upward least resistance. The Fibonacci level is also around 38.2 percent and approaching towards 50 percent.

Oscillators are providing mixed signals because of the recent bearish rally. Stoch is going downward while RSI is moving up and is currently at 55 percent.
Market Update
The tightening of the South Korean regulation is affecting most of the cryptocurrencies. Traders are continuously liquidating the asset and this is baring the coin to regain its prime.
Several firms are also withdrawing their Bitcoin ETF proposal amid concerns about SEC regulations. These moves are undermining the confidence in the cryptocurrency.


