Trend trading is good when the trend is strong. But what do you do when there is no strong trend? How do you even know? Divergences can come to your help.
What is divergence?
Oscillator-type indicators are among the most popular technical analysis tools. It doesn’t matter which one you use, as they all pretty much do the same in a slightly different way. For trend traders they are invaluable as they provide entry and exit signals in an easy-to-follow manner. They act like an X-ray for the market. Oscillators can tell you what is really going on behind that rally or sell-off. Sometimes there is strength and sometimes not.
The most common method used with oscillators such as stochastic, MACD or RSI is to follow the trend. The trend can be determined in a number of ways including multiple time frame analysis, trend lines and moving averages. Once the trend is determined signals are filtered based on its direction. The strength of the trend is measured by convergence. If the oscillator is moving up alongside prices it is said to be in convergence or agreement with the price action. If price action creates a peak and the oscillator makes peaks at the same time, and then both make another peak higher than the first that is also said to be convergent. Prices are gaining strength and so is the oscillator; this is a sign of a continuation within the market.
Note: oscillators give signals irrespective of trend. It is our duty as traders to weed out false, bad and lower probability signals.
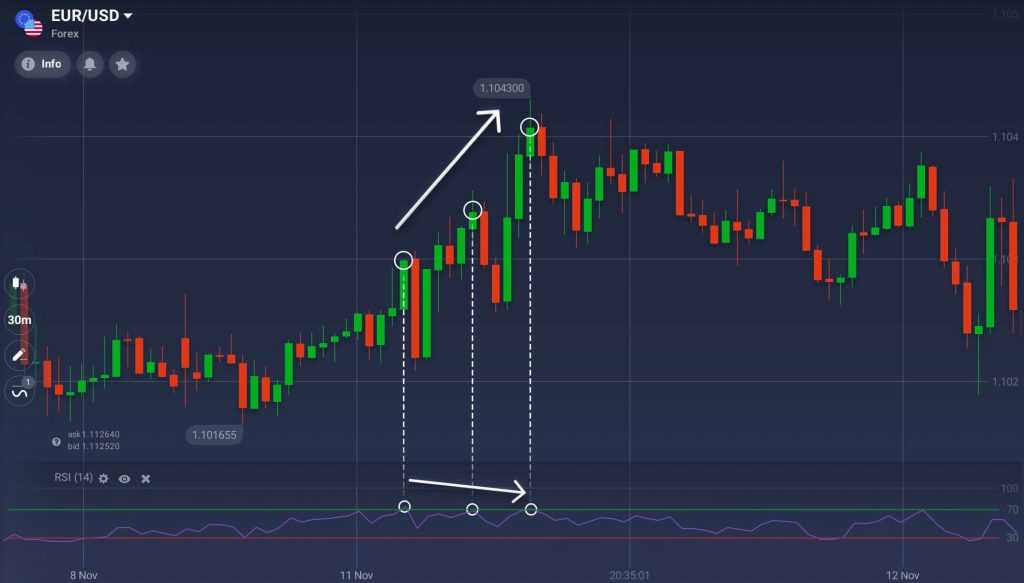
A divergence is when the price action creates a new, higher (or lower), peak but the oscillator’s peak does not match. In the case of an uptrend prices will make a higher high but the indicator will make a lower one. In the case of a downtrend prices will make a lower low but the oscillator will make a higher one. This is an indication of the underlying weakness within the market, the slow death of the trend in question and the possibility of an upcoming reversal.
Take a look at the chart below. This is what a divergence may look like: while the price action goes up, forming higher highs, the indicator itself is going down. A new trend can be spotted soon.
Limitations
The caveat for traders is that divergences are not always a strong signal. An indicator can be in divergence within a trend for some time before a correction or reversal happen. This is why divergence trading requires additional confirmation, above and beyond what you might seek with a trend following signal.
For example, prices may have bounced from support within a greater trading range. On its way higher the bounce creates one, and then another peak within the near term uptrend with divergence showing in the indicators. This divergence suggests that 1) the rally is weak and not likely to extend beyond resistance and 2) that bearish candle signals and/or tests of resistance can be the reversal points. With this in mind, when a divergence appears on your chart, look for likely points of reversal within the trend you are analyzing. Then watch those points for secondary confirmations such as candle signals or other price patterns (head and shoulders, double top/bottom).
Note that divergences are not quite common and are not always easy to spot. It will take some time for you to familiarize yourself with this type of signal and learn how to use it in trading.


