
US consumer level inflation in the form of CPI, the consumer price index, gained in May and is accelerating over the long term. This data would be important, or more important, if it was not expected. While hot, the figures do not alter the current FOMC outlook but that doesn’t matter because they aren’t the star of the show. The FOMC has long been expected to raise rates this week, the question regarding them is how they will sound in relation to future rate hikes. No, the star of this week’s show is the ECB because they’ve indicated a shift in policy stance that will bring the Euro back into dominance.
In the US CPI rose 0.2% in May and as expected. Energy played the biggest part in this month’s increase led by gasoline, up 1.7%. On a year over year basis CPI increased 2.8% also as expected and up from the previous month’s 2.5%. At the core level CPI rose 0.2% MOM and 2.2% YOY, well within the FOMC’s target range. The concern is that CPI has shown steady gains all year, the mitigating factor is that the PCE price index shows core inflation is, so far, contained.
In the EU business sentiment slipped -12.6 points versus an expected positive albeit low reading of 0.1. This is due in large part to political unrest in countries like Italy and Spain along with ongoing and escalating labor disputes with the US. The news is noteworthy but not a concern as economic conditions are improving and the ECB is on track to end its QE program sometime this year or early next.

The EUR/USD steadied after the data as market participants await the FOMC and ECB statements due out Wednesday and Thursday. The pair is in consolidation below resistance at the short term moving average and gearing for its next move, likely spurred by the ECB. A break above the moving average would be bullish and could take the pair to 1.2000 in the near term.
The dollar gained versus the yen as strong US CPI supported the risk-on asset and easing tension on the Korean peninsula fueled outflow from the safe-haven yen. The USD/JPY moved up in an extension of Monday’s bounce from the short term moving average and broke to a new near term high.
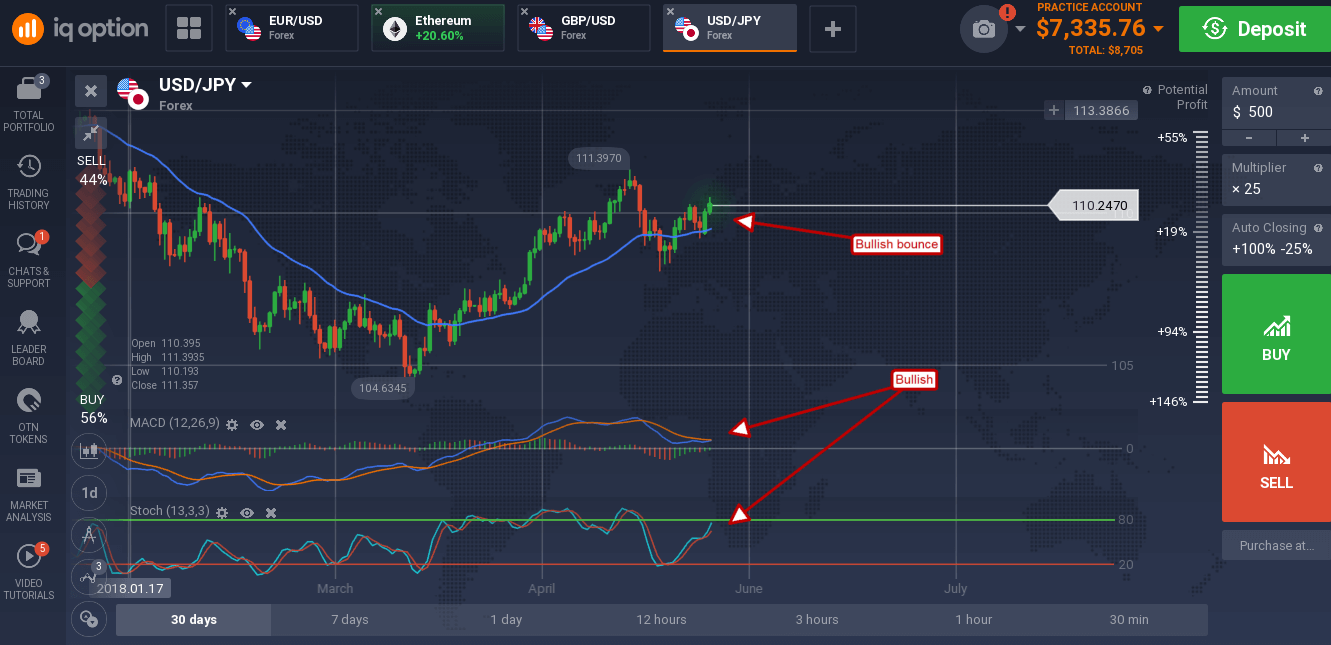
The move is bullish, trend-following and supported by the indicators so additional upside should be expected. The next target for resistance is 111.75, a move above that would be bullish.
