
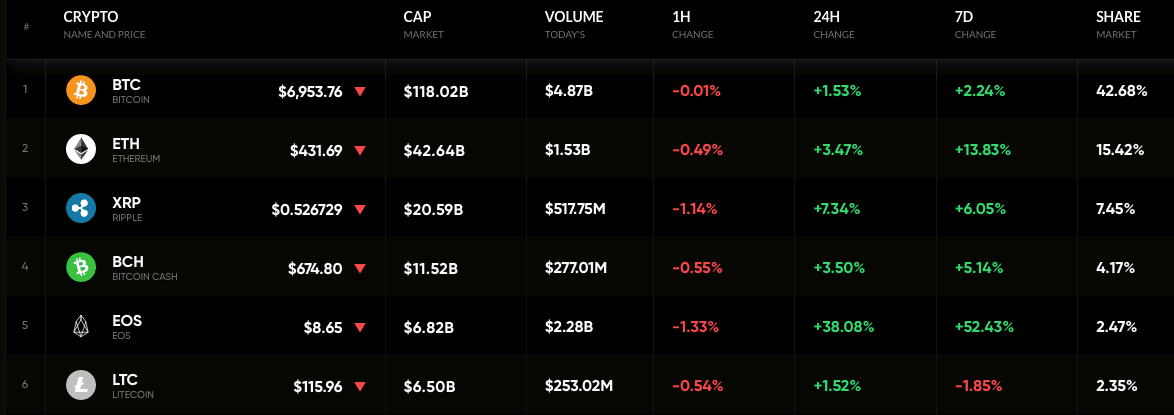
Though there is no significant change, the cryptocurrency market is on a positive track. Most of the coins added value to them in the past trading sessions with some exceptional outliers. The total market cap went up to $277 billion – gaining $11 billion in last 24 hours.
Cryptocurrency market data by coinrate.com
The detailed movement of the coins can be found out at coinrate.com.
EOS
EOS stunned the market in the recent hours, by attaining a massive upward momentum. Among the top 20 coins, it is the top performer and even dwarfed the growth of others. In last 24 hours, EOS added 38 percent to its value, which resulted in a week-on-week appreciation of more than 52 percent. This gaining prices soon attracted the attention of traders, and due to an influx of the traders, the trading volume in last 24 hours jumped to $2.2 billion – a massive number for a coin with a market cap of $6.82 billion.
Moreover, EOS surpassed LTC in terms of market cap to become the 5th largest coin in the market.
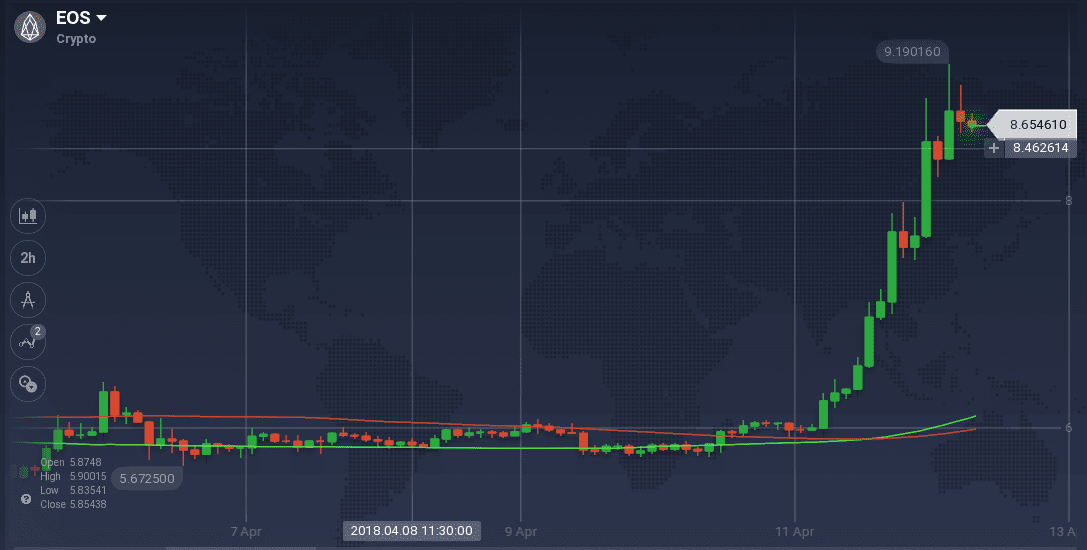
On the weekly chart, EOS mostly moved in a timid manner until recently. Most of the week, the coin faced resistance between $5.9 to $6, which acted as a massive barrier on its path. However, various support levels between $5.7 and $5.8 did not allow a plunge in the coin’s prices.
On the daily chart, the coin gained an upward momentum and with a strong trend went past $9.0. Though the coin faced minor resistances on its way up, the trend was strong enough to pass through them. Currently, due to some peak resistance at $9.0, EOS has taken a downturn. However, the impact of the trend is still there and with the influx of the optimistic traders, the coin can zoom up more.
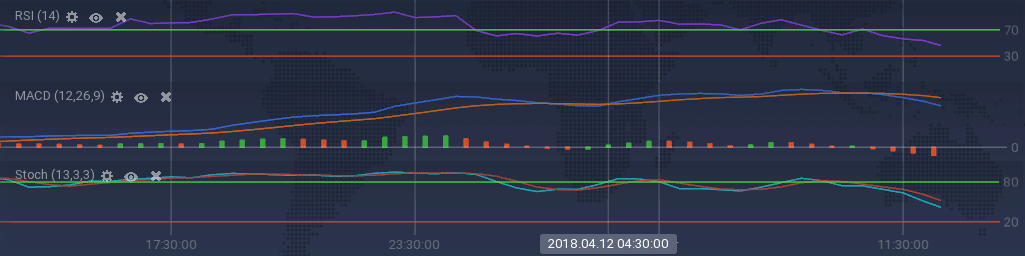
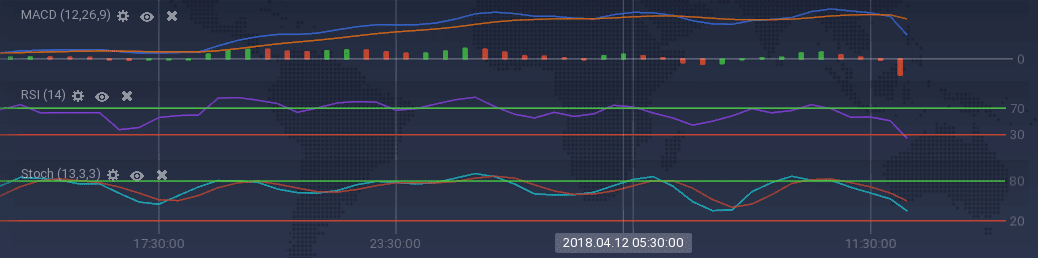
As the coin is facing peak resistance, the technical indicators have taken a downturn after running bullish for hours. Stoch and RSI both went down from the overselling zone and is currently moving down. MACD is also showing a similar signal after soaring for hours. Moreover, due to the massive bull on the charts, 100 SMA went over 200 SMA showing the dominance of the bull on the coin.
QTUM
QTUM added a significant amount to it in the last few days. It went up by 6.8 percent on the daily chart and 8.3 percent on the weekly. Though it holds $1.2 billion in market cap, the recorded trading volume was more than $153 million in last 24 hours.
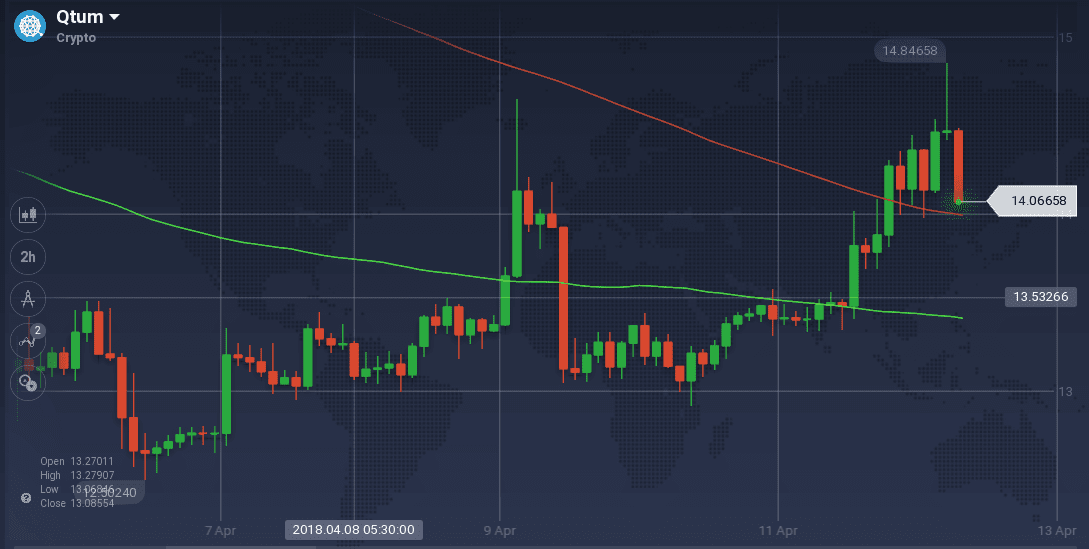
QTUM’s journey on the charts was dominated by two significant bulls, however, there were momentary dips as well. Before jumping from $12 to above $14, the coin incurred a massive loss as it dipped from above $15. Though the coin dropped to $13 after the rise, it gained the upward momentum again and zoomed beyond $14.5 to touch the weekly peak.
However, the coin is facing some peak resistance recently as it suddenly dropped to $13.6.
The sudden dip recently has forced to indicators to dive as well. MACD and ADX are signaling a massive bear after soaring for a while. Stoch is also signaling bear with a reversal from the overbuying area. Moreover, RSI has dived below overselling mark and is currently at 26 percent.
Conclusion
Though the market is showing many positive signs, the bulls are not out of the woods yet. However, many outliers like EOS have made a significant impact on the market. Considering all the factors, it is wise to remain optimistic, however, predicting a wild market like this is not an easy take.