The US non-farm payroll figure showed job gains of 157,000 in the month of July. This figure is well below expectations and the 219,000 indicated by ADP earlier in the week. It is positive and in line with trends but may indicate slowing growth, if you take it at face value.
The headline NFP figure is a decent gauge of economic health but it is flawed. It is based on two estimates, the estimated number of job losses and the estimated number of job gains, which makes it a “best guess” at best. The figure is so loose that it gets revised not once, but twice before finalization which means revisions and trend is more important.
With revisions the July NFP figures show a more robust increase of 216,000. This is in line with expectations and above the twelve-month average. The twelve-month average has job gains in the range of 205,000, a figure above that such as we have this month points to acceleration within the economy.
Adding strength to this month’s report is a drop-in unemployment, to 3.9%, and an uptick in average hourly earnings. Unemployment is trending lower over the long-term and at lows not seen since before the 2008 global financial crisis. Average hourly earnings increased by $0.07 over the last month and are up 2.7% over the last year. These figures show robust growth in labor market strength and sustained wage inflation in line with the FOMCs long-term outlook.
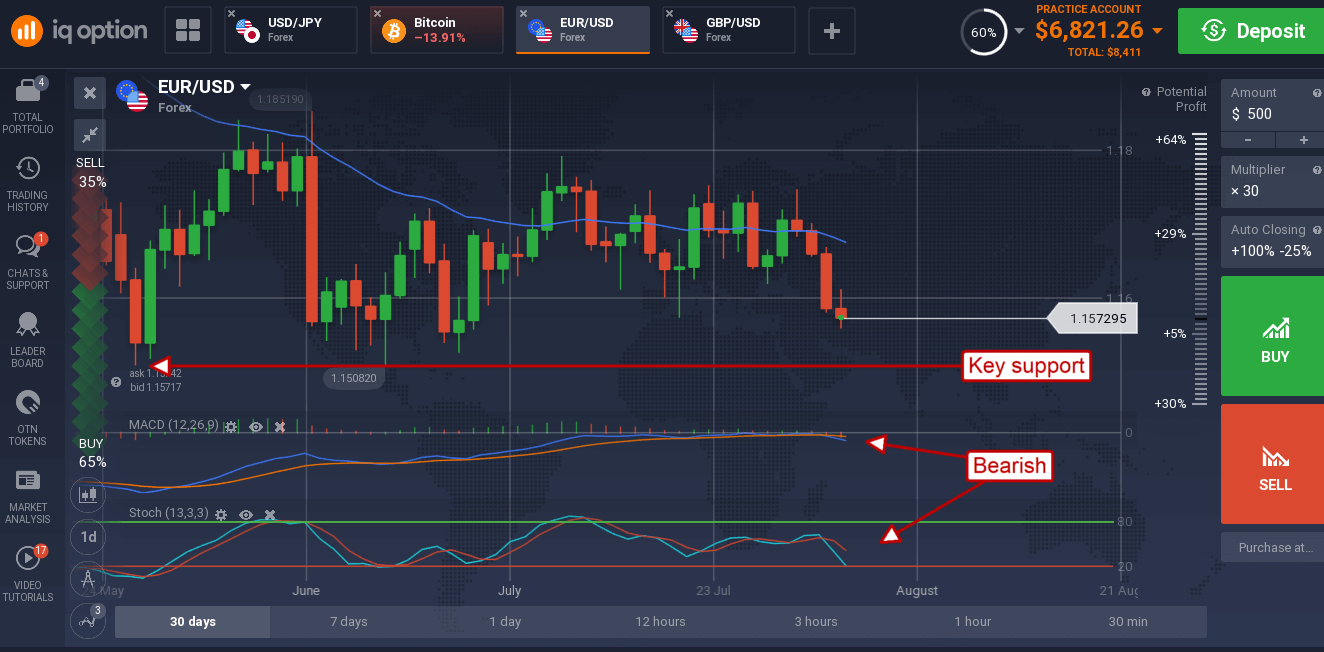
The USD wobbled a bit on the news but resumed its upward march once traders had digested the full report. The EUR/USD moved down to a new one month low on the news and is now sitting just above the long-term low near 1.1530. The indicators are bearish and support a move to this level. A move below 1.15300 would be very bearish and could lead to a prolonged decline in the pair.
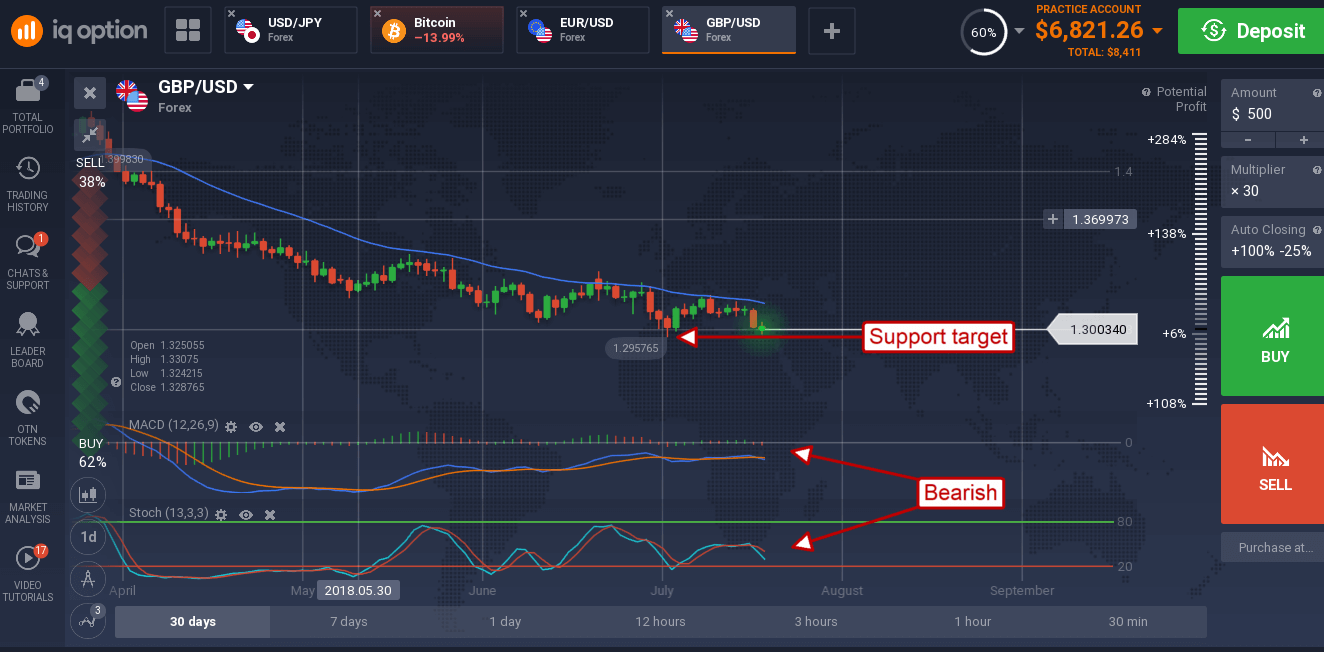
The GBP/USD also moved lower on the news. The pair is testing support at 1.2990 and may move lower. This level is a key support target and, if broken, may lead to an extended down turn in prices. The pair is supported by this week’s BoE rate hike, but outlook remains favorable to the dollar. The FOMC is still on track to perform 2-4 hikes over the next 12 months and the BoE is not. A move higher is likely to find resistance at the short-term 30-day EMA.
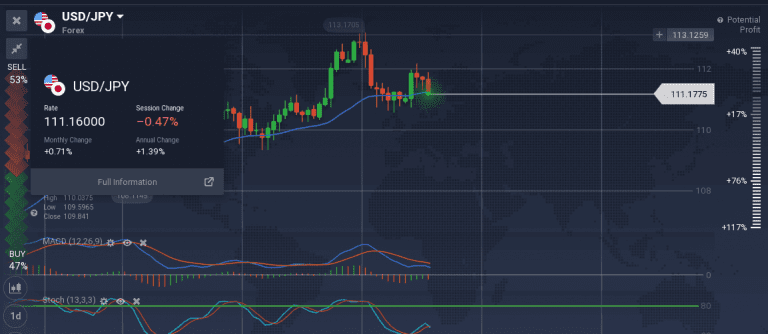
The USD/JPY continues to languish within a consolidation zone as geopolitics outweigh fundamentals. US economics are strong and the FOMC is hawkish, so a long-term uptrend should persist.
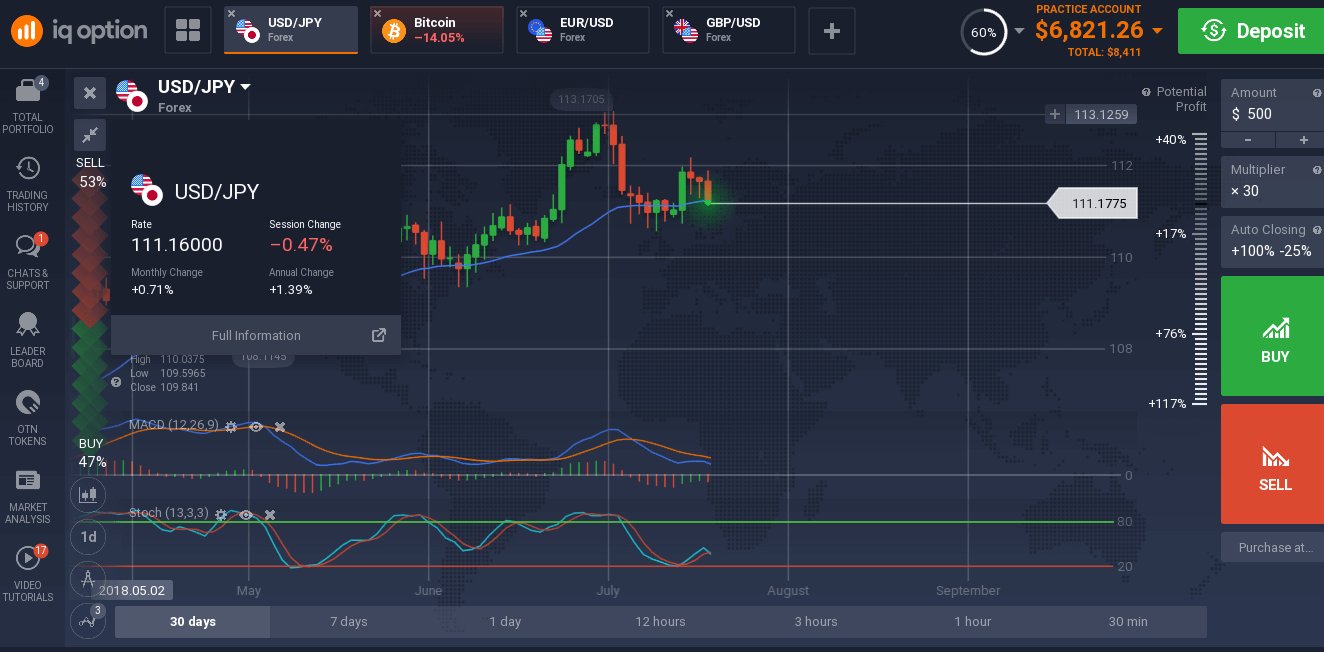
Nearer term the yen is favorable as a risk-off asset and that is keeping the pair from moving higher. The indicators are mixed but consistent with support within an uptrend so no worry there yet, support is at the short-term moving average. A move up would be bullish, a move below the short-term moving average would be bearish.
