Candle patterns appear everyday but do not always match the textbook definition, this is a practical look at the powerful Rising Three Methods.
Candlestick indications are great. They give powerful insight to the market, its condition and the direction of prices. Most candlestick patterns are well discussed in books and on the Internet. The problem, in most cases, is that the patterns used for educational purposes are, quite literally, textbook examples. What I mean is, they are perfect easy to spot versions of what the pattern is and not what you will find in the market most days; hard to read patterns and/or patterns that don’t quite fit the textbook definition.
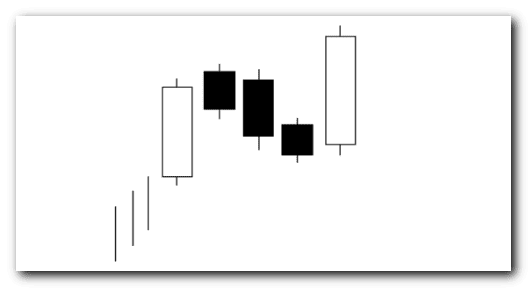
The pattern I want to discuss today is the Rising Three Methods. The Rising Three Methods is a continuation pattern often found with market rallies. It consists of 5 candles including two long green candles and three small red candles. The first candle is a long green one, it indicates a strong upward movement in the market. The next three candles are small and red and form within the body of the first. They indicate consolidation. The next candle is another long green candle that forms within the body of the first, engulfs all three red candles and closes at a new high. It indicates the rally is still on and confirms higher prices to come.
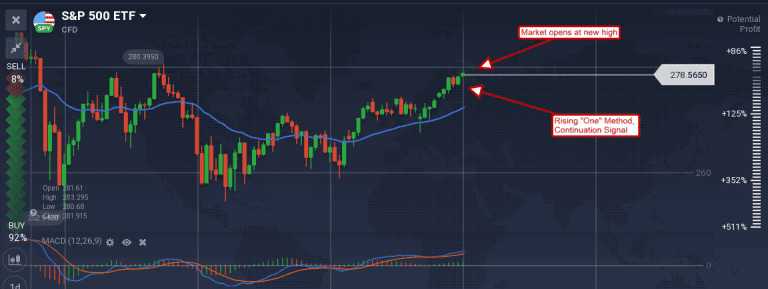
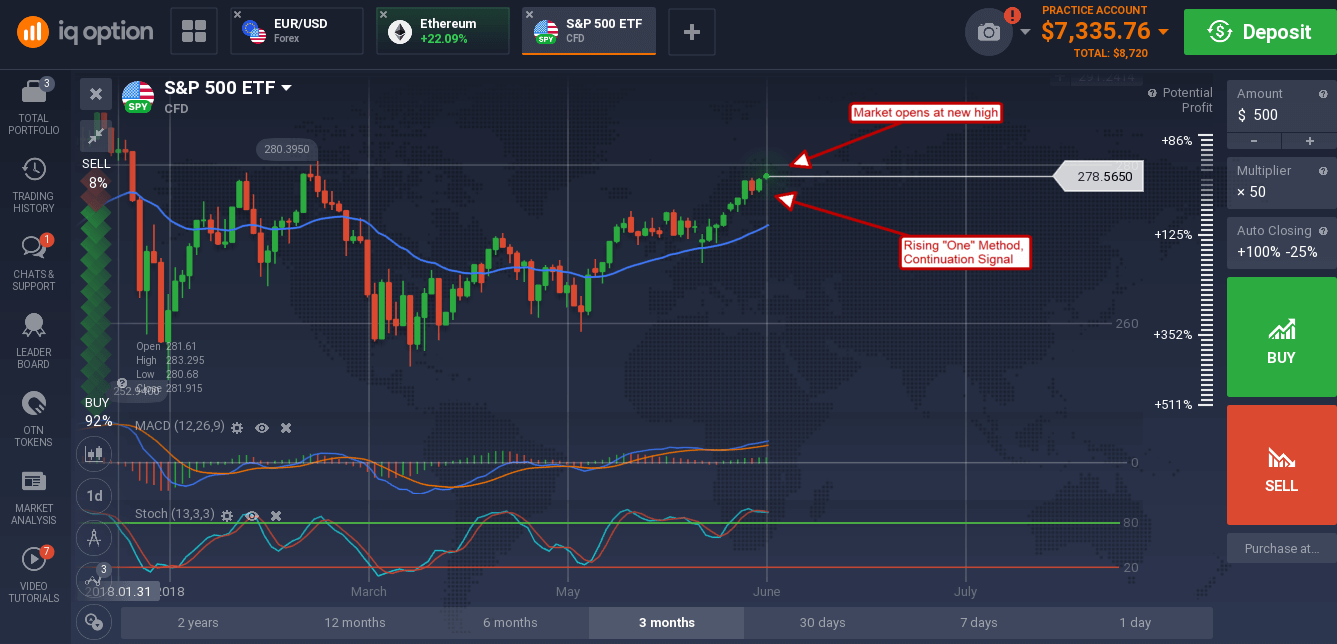
In practice you will find a Rising Three Methods that looks just like the textbook, but not always. In fact, the US broad market index S&P 500 is forming a variation of the pattern I will call Rising One Method. Take a look at the chart below. The SPY S&P 500 index tracking stock has formed a long green candle, a small red candle and then another long green candle that breaks to a new high. The pattern has all the hallmarks of a Rising Three Methods except there is only one red candle. The difference between the two, the textbook version and this one, is slim. Both indicate continuation.
So, now that a pattern has been identified how do you trade it? You can jump into a trade like this as soon as the signal confirms with a reasonable chance of profiting. The key is to keep resistance targets in mind, and to project take-profit levels based on the Rising Three Methods pattern and the rally leading up to it. In this case the underlying index, the S&P 500, rallied 100 points from a low to the high of the pattern. If you project 100 points from the high of the pattern you get a target of 2,880 and the all-time high.
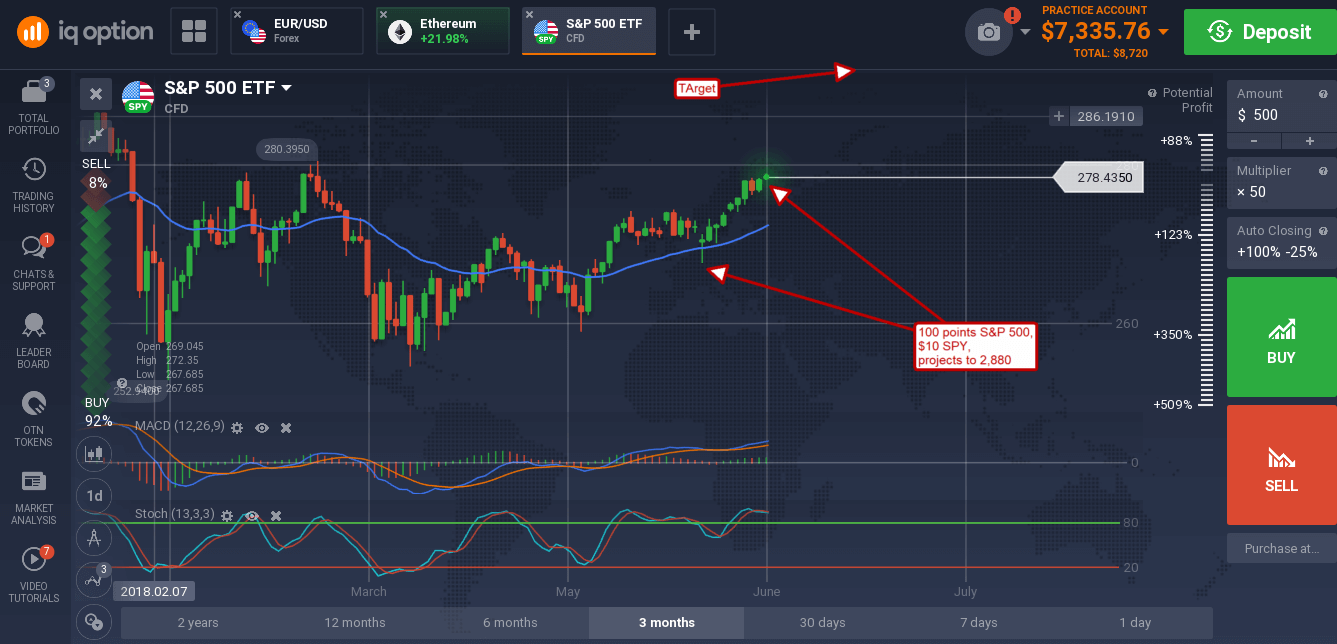
The caveat is a potential resistance level at 2,800. More cautious traders may wait for this resistance level to break before entering a trade. In this case a trade could be entered when the resistance breaks, or when prices retreat to retest that level (resistance) for new support after the break out occurs.
