Trading community de facto applies RSI indicator to define levels of overbuying/overselling levels on market. Even without use of additional filters, indicator works good. Have a look on applying RSI that even more increase accuracy of the indicator.
Standard way to apply RSI:
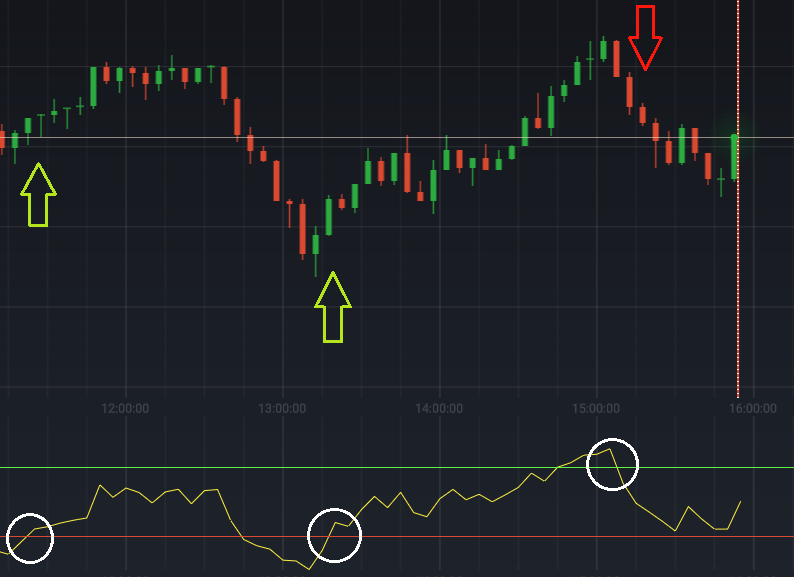
The first, traditional way – buying option at the moment when RSI exits the zone of overbuying/overselling.
- when the value of RSI line gets lower than overselling level of 30% usually, bears force weakens and that means, the exit of an indicator from this zone is the right time to open position for raising;
- when values get higher than overbuying level of 70% usually, one needs to consider variants of entering on downturn.
Buying option is an operation strictly to be provided only by the moment when indicator exits overselling/overbuying zone.
RSI on minor timeframes
2nd way. If you trade turbo options or binaries with expiration time less than 30minutes, 70 and 30 levels not always allow to execute accurate enterings. Period should be decreased for indicator to reach its extreme values more frequent. For timeframe less than hour one may usel RSI equals 5 and 90 to 10 or even 95 to 5 levels.
Here is an example of setting Rsi to 90/10 and 5 period.
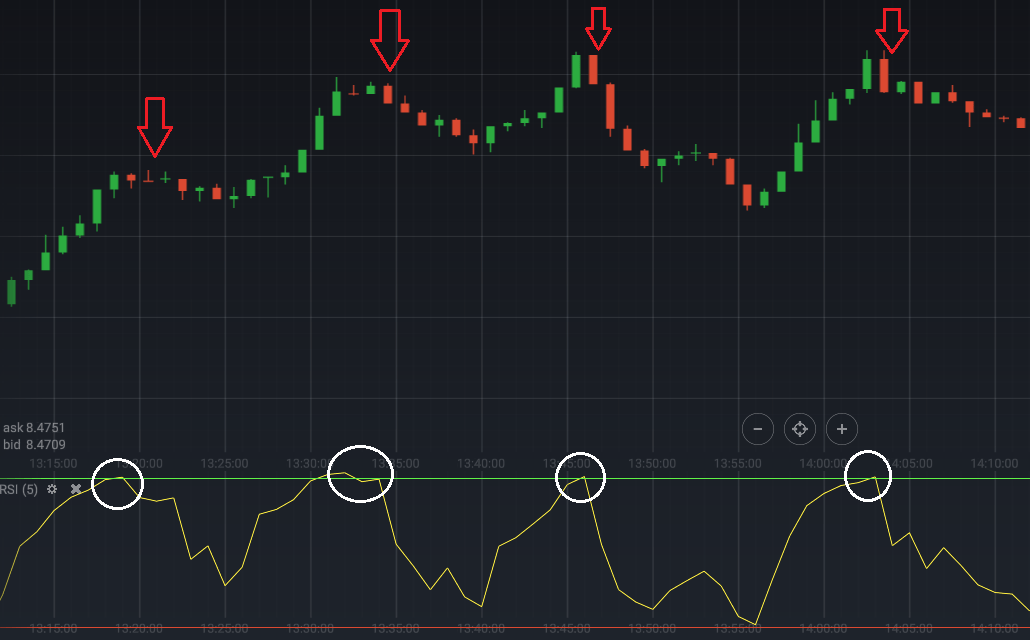
3rd way. For additional approval you need to pay attention on higher period in order to see the global trend. Trading binary options opposing the trend is the bad idea, thus signal direction on current timeframe and one above must match together.
That is how signal approve looks on 1 minute and 5 minute charts:
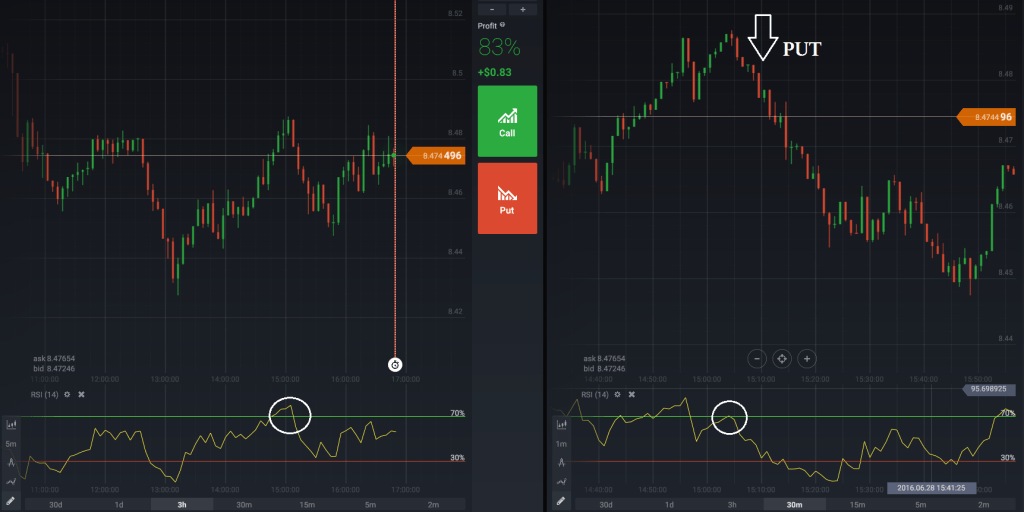
Period and levels of RSI should match together on both charts.
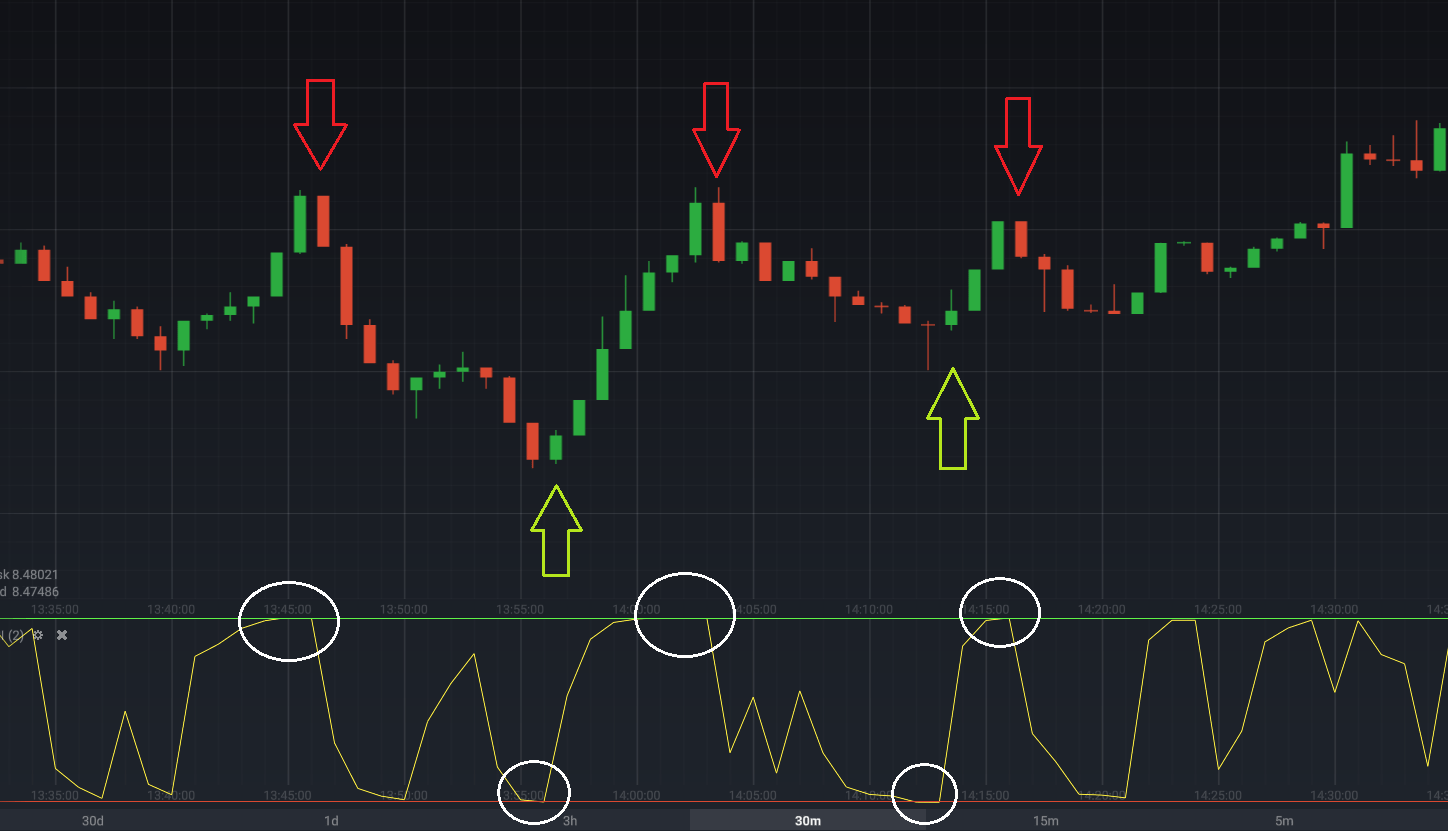
4th way. There is scalping technique for supershort deals. This trading method is being frequently applied by american traders. The feature of the strategy is to get large amount of signals during a small period of time. The main goal is to absolutely minimize response time of an indicator.
Settings:
- RSI period equals 2 bars;
- Overbuying limits are also set maximally possible – 99 for overbuying and 1 for overselling.
As usual, this strategy is used on chart M1 or M5. Expiration time of binary option usually does not exceed 5 minutes.
RSI Divergence
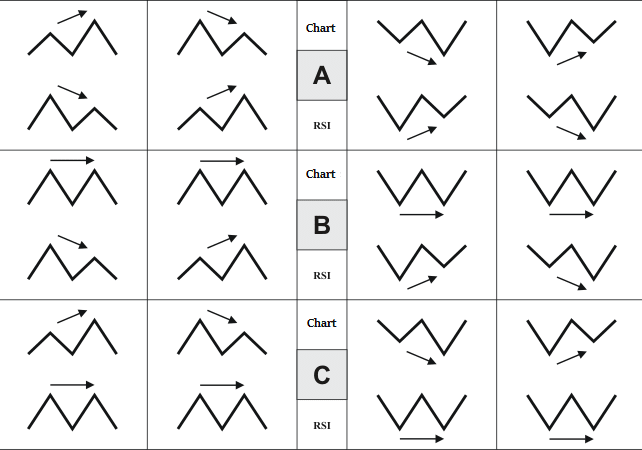
5th way – searching for divergence on chart is an effective method of getting RSI signals. Divergence is a dissimilarity between chart and indicator values, for example when the chart draws higher and indicator shows lower maximum.
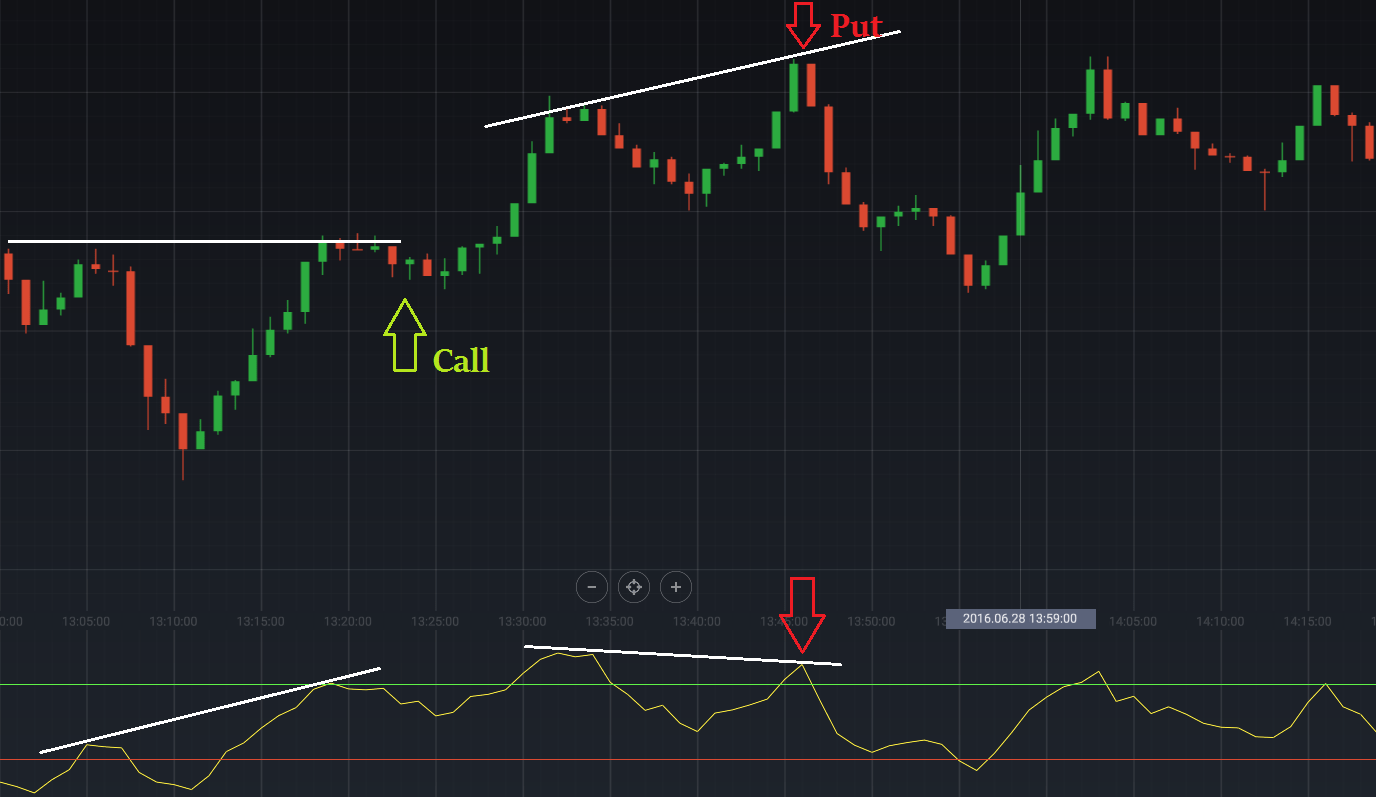
The example of divergence – two maximums on chart are on the same level while on the indicator chart the second maximum is much higher:

The thing to remember – you need to trust exactly what indicator shows, if it grows – we buy option CALL, if it decreases – PUT.
The example of entering the position on the basis of RSI divergence:
RSI & Bollinger Bands
The last, 6th way – to combine RSI indicators and Bollinger Bands, because the first one shows impulsive movements and the second shows the main direction of market movement. As a result we get very precise signals on entering the position.
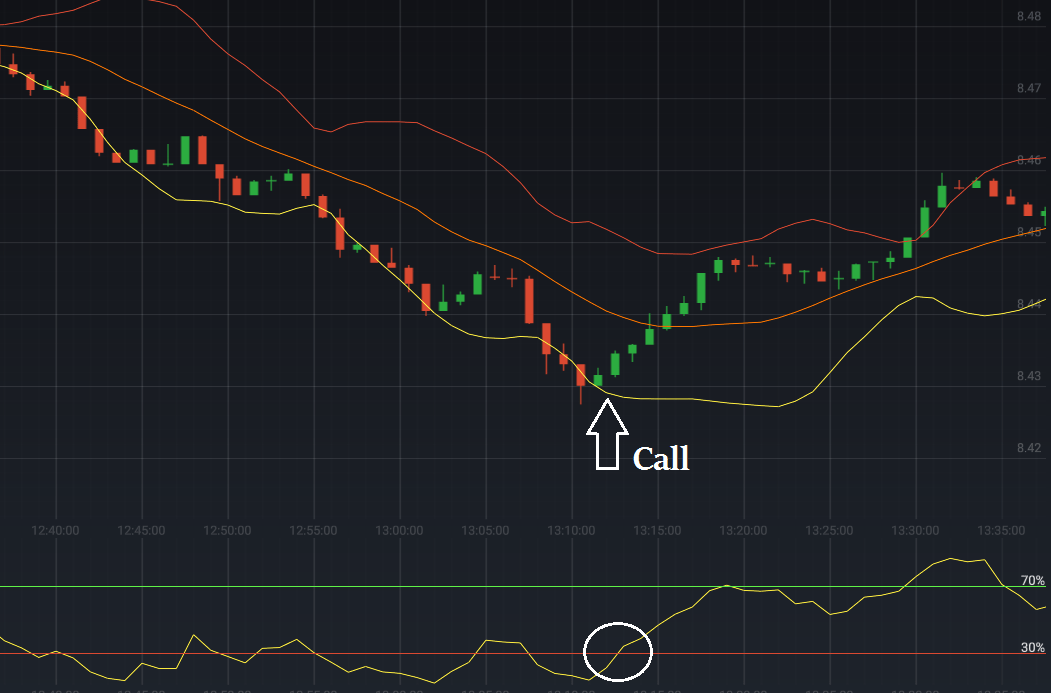
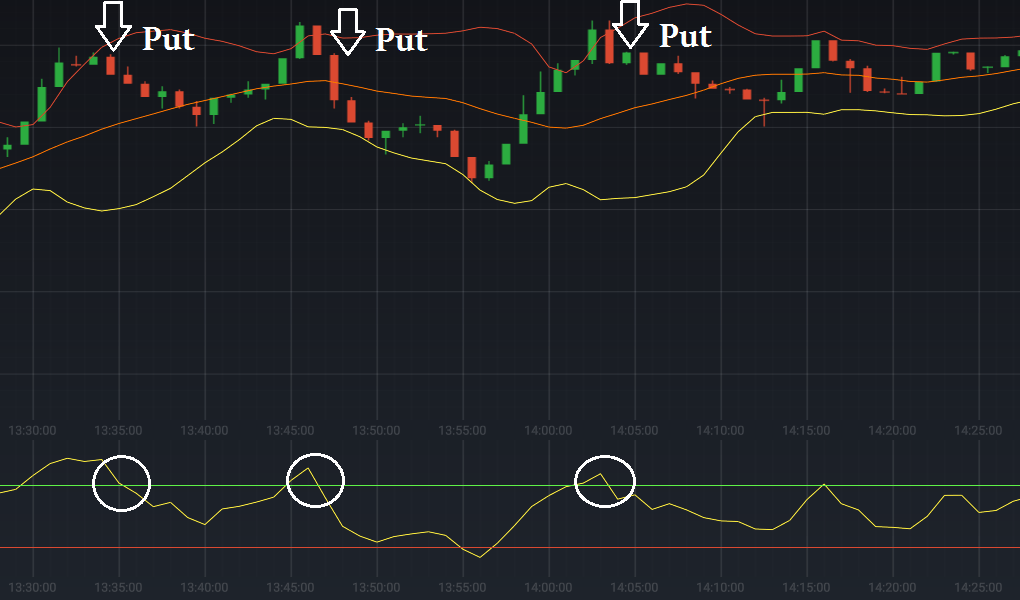
The rules of trading on RSI are fairly standard. Purchase PUT option by the time indicator line exits the overbought zone, or CALL option, when indicator line exits the oversold zone. But one should enter only in case the price is situated near the bottom line of Bollinger Bands, which should act as a filter. Ideally, the price should exactly overcross the line by the moment of receiving RSI signal.
In case of Сall signal, the price of opening the breakout candlestick should be above the line. The closing price above:
All the same is true for PUT-signal, in this case the price therewith should simultaneously cross the top line of a channel – Opening price higher, closing price lower (inside the channel):
The expiration time may vary depending on used timeframe. Ideally, the expiration time should be equal to quantity of bars needed to achieve the floating average (average line of the channel) from the edges of the channel. One may calculate the average quantity of bars needed to pass the distance from one edge to another and divide it by 2.
Conclusion
The most famous and widespread indicators are able to become the basis of profitable trading strategy if one uses it properly. We discussed several simple ways of increasing the percentage of succesul deals through the traditional RSI strategy. Try to use these methods on free practice account.
Traditional indicator have become so merged into the trader’s lives, that many just don’t consider them as the serious trading instrument. At the same time, the majority of more up-to-date developments are based on the same RSI or floating averages. The primary benefit of RSI is its versatility, this indicator might be used on currency pairs, trade stocks or goods with equal success and without loss of quality.

