You may find the best trading indicators in the Popular section in the traderoom. Why? Because these indicators, as well as the other five that we have already covered in a previous article, are commonly used by all kinds of traders. These indicators became most popular for a reason. Both experienced professionals that have their own trading strategy figured out, and novice traders use them regularly. Here is a quick overview that will take no longer than 5 minutes to read. Save it to refresh these tools in your memory. Let’s go!
1. Bollinger Bands
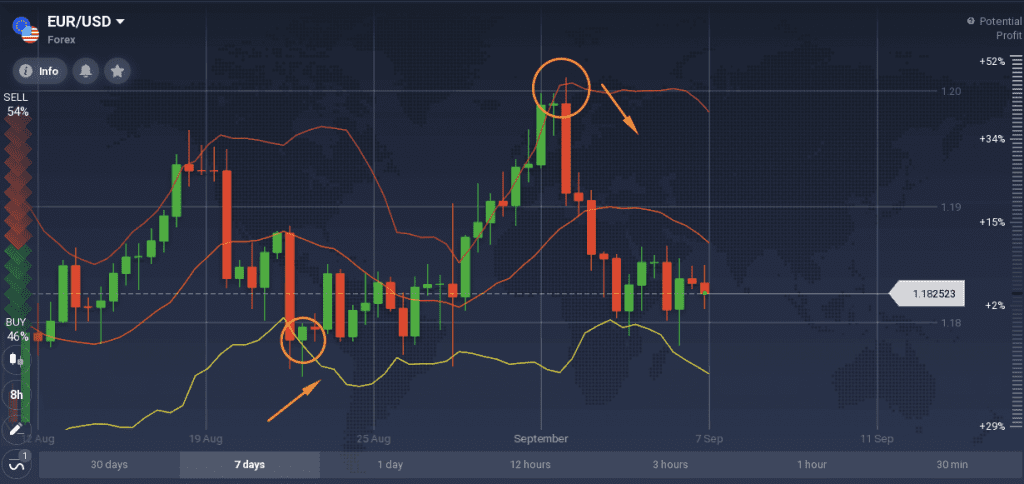
The indicator consists of a moving average and two bands, above and below the MA. When these bands are far apart, it indicates high volatility. A signal to Buy is received when the candlesticks cross the bottom band upwards. A Selling signal is received when the chart crosses the upper line downwards. Reversal is detected when the candlesticks cross the moving average in any direction.
2. Average Directional Movement Indicator (ADX or DMI)
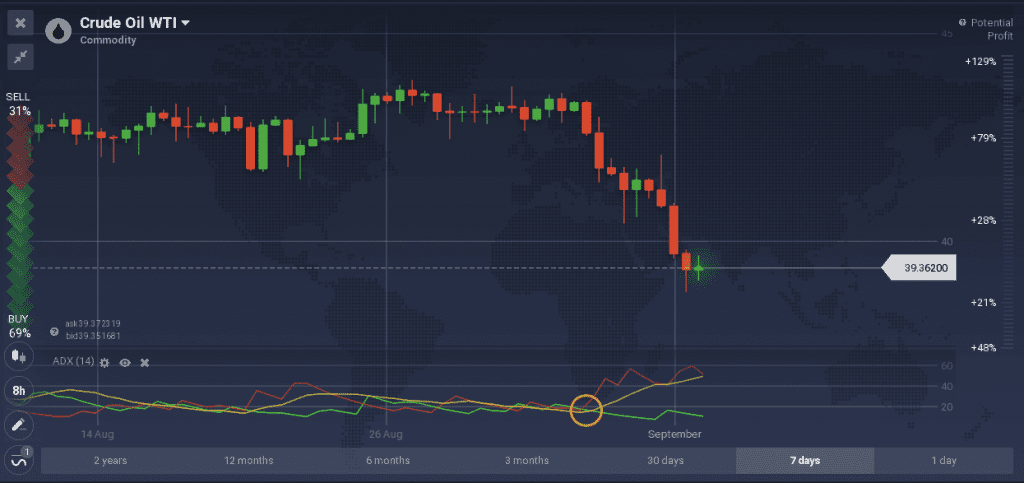
ADX is another example of the best trading indicators for technical analysis on IQ Option. It displays the strength of the trend. It is a leading indicator that is normally used with the standard settings. It can be successfully combined with Bollinger Bands. The wider apart the green and red lines are, the stronger the trend.
An upward crossing of the red line by the green one indicates a bullish trend. When the red line crosses the green one upwards, the trend is bearish.
3. Fractal
The main idea of the Fractal is to show the minimum and maximum of the price curve and indicate the trend reversal points on the chart. Many traders use it to help set the support and resistance levels.
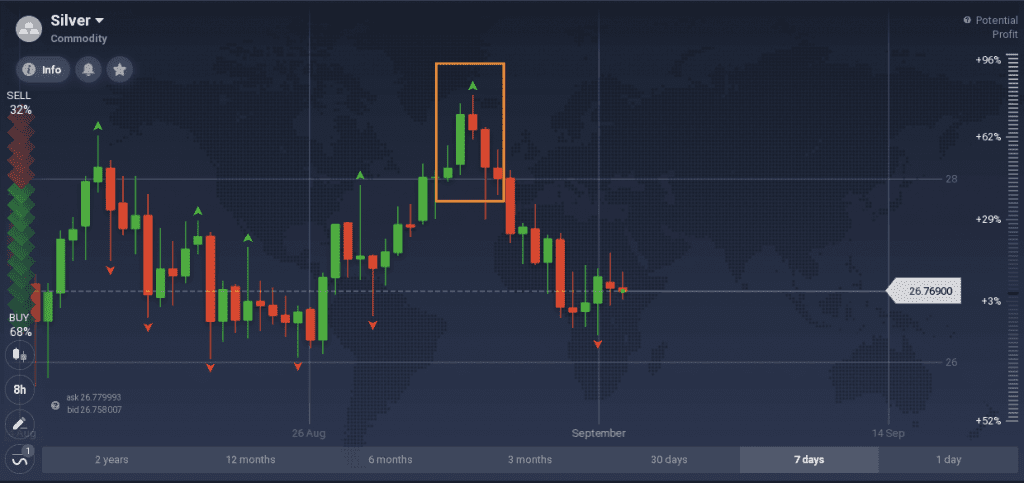
The Fractal indicator signals a downtrend when the highest candlestick in the middle is followed by two lower candlesticks, the Fractal is facing upwards (as shown in the example above). An uptrend is emerging when a lowest candlestick is followed by two higher candlesticks, with the Fractal facing downwards.
4. Awesome Oscillator
As a lagging indicator, the Awesome Oscillator follows the price, therefore it doesn’t predict the future developments and works best during trending periods. It is considered a simplified version of the MACD indicator. For example a Buying signal is received when the bars move from below to above the baseline, while a Selling signal can be observed when the bars switch from above to below the baseline.

5. Detrended Price Oscillator (DPO)
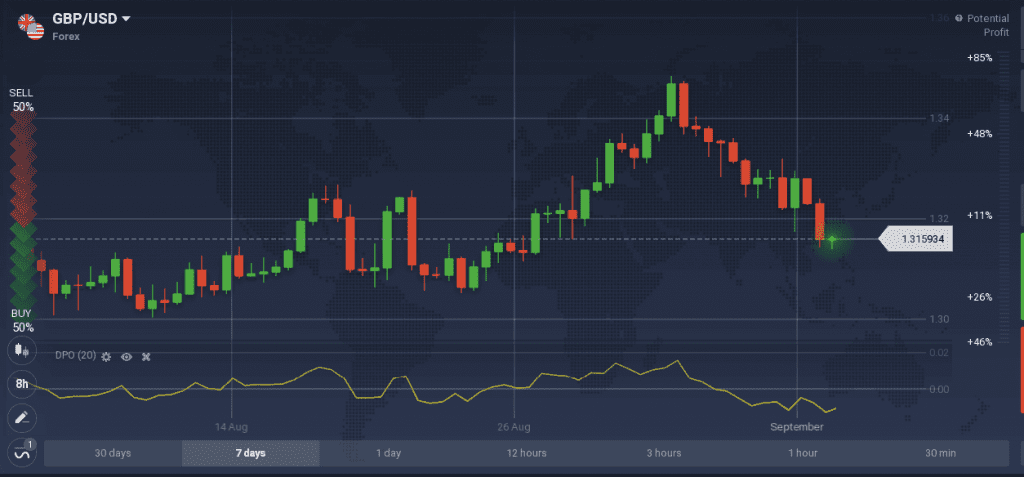
This indicator is designed to remove the influence of the general trend from the price action in order to make it easier to identify cycles. It can be useful for short-term traders, who are not interested in the long-term trend. DPO measures the differences between the past price in a cycle and the moving average. It is positive, for instance, when the price is above the average and negative when it moves below the average. This indicator is a supportive tool and it can be combined with the Alligator or MACD for more accurate predictions.
So, which one of these trading indicators to choose? This will completely depend on your trading approach and preference. More experienced traders may change the settings of these indicators, however, all of them can be used with the standard settings as well. Please note that no indicator can guarantee 100% success every time, so a risk management strategy is always necessary.
