Trading is all about staying ahead of the curve — and sometimes, ahead of the chaos. In this article, we’re breaking down three powerful binary options strategies that could help you stay ahead of the market. Think of it as your shortcut to smarter trades — no magic, no guesswork, just clear steps and effective tools. Ready to discover the best binary options strategies that will make you wonder, why didn’t I try this sooner? Let’s dive in.
1. RSI and Center of Gravity combo: A momentum masterpiece
This strategy is a hidden gem for traders looking to capitalize on market momentum shifts. By combining the RSI (Relative Strength Index) and Center of Gravity indicators, you can pinpoint potential reversals and validate signals for confident trades.
Here’s how this binary options strategy works.
The RSI
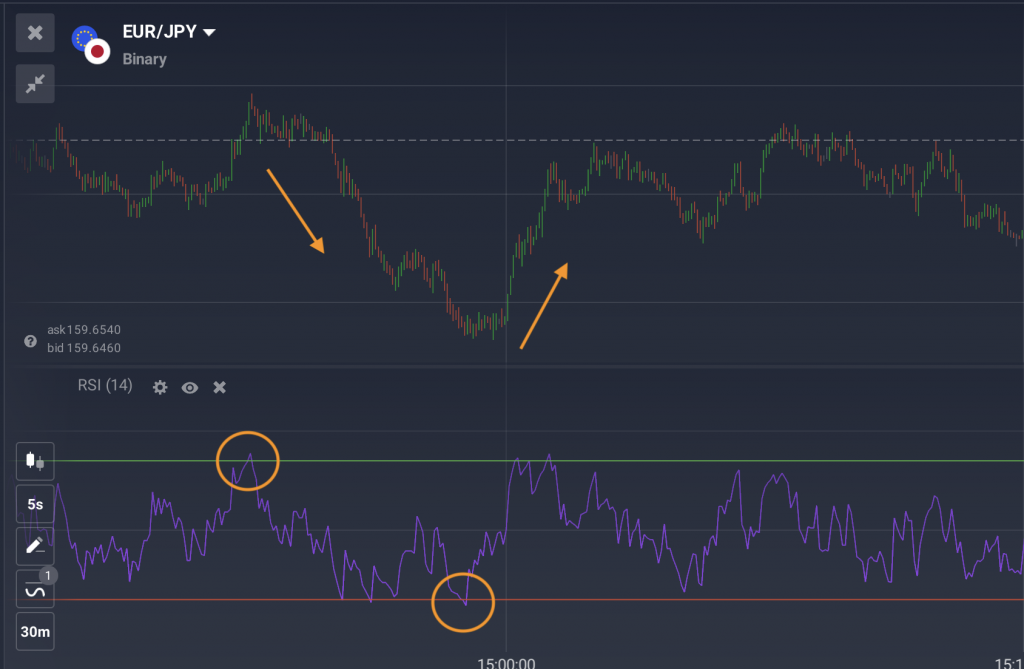
The RSI indicator can point to overbought and oversold levels for an asset, helping you identify upcoming shifts in the trend. Typically, an overbought condition of an asset can lead to a price decline in the near future. This may allow the trader to open a short (SELL) position. On the other hand, an oversold asset may shift to a price increase, creating an opportunity to open a long (BUY) position.
✍️
Conversely, when the RSI line touches the level marked ‘15’ (red line), the asset is seen as oversold. This could mean an upcoming movement in an upward direction.

You can adjust the indicator settings in any way you like. However, for this strategy, the optimal RSI settings are the following:
- Period: 14
- Overbought: 85
- Oversold: 15
Center of Gravity
Once you’ve assessed the asset using the RSI, it’s time to move on to the second part of this binary options strategy. Now you are looking for a confirmation of the RSI signal (overbought or oversold).
✍️
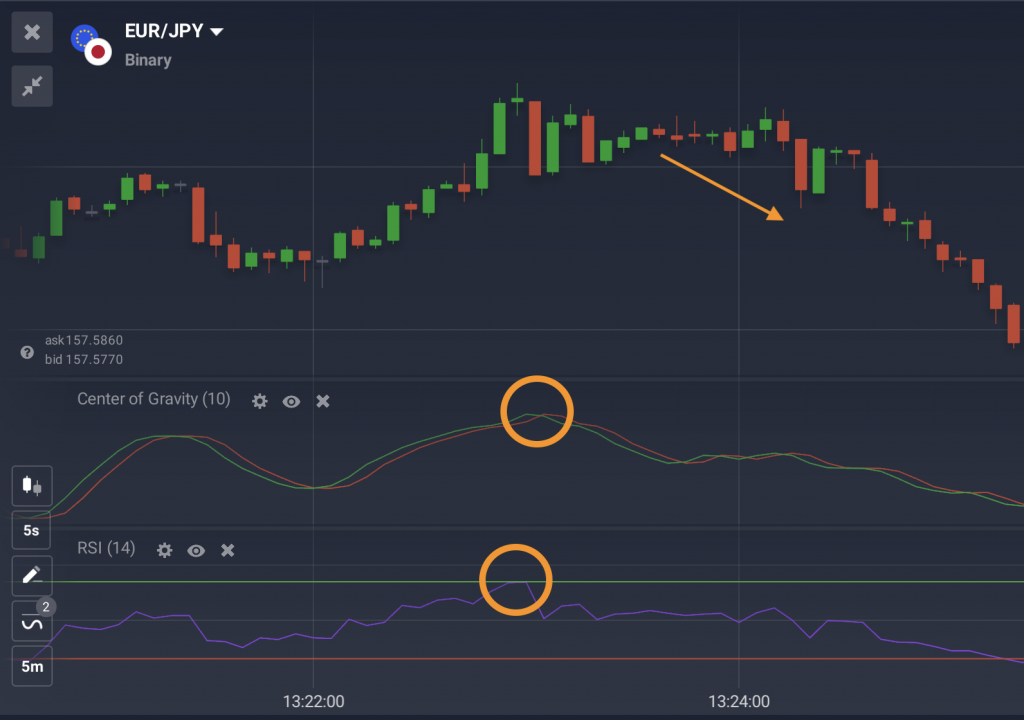
When the green line crosses over the red line and gets on top of it, this may suggest a turn to a bullish trend, hinting at a potential HIGHER trade.

You can leave the default settings for this indicator:
- Period: 10
RSI + Center of Gravity
Now let’s put these tools together and have a look at the full binary options strategy.
It may be time to consider opening a long position (BUY), when you notice the following trends:
- The RSI indicator line is getting closer to the level of 15, pointing to the asset being oversold.
- The Center of Gravity’s green line is crossing the red line and moving higher.

Once you’ve identified these signals, don’t wait too long. You may open a long position for the next 2–4 candlesticks.
On the contrary, it may be time to consider opening a short position (SELL), when you catch these signals:
- The RSI line moves closer to the level of 85, hinting at the asset being overbought.
- The red line is crossing above the green line in the Center of Gravity.

These signals point to an upcoming bearish trend, so it could be a good idea to make a trade within the next 2–4 candlesticks.
This simple yet powerful approach ensures you’re making decisions based on reliable momentum and confirmation signals.
2. Calm Channels: Trading in the quiet zone
Think of this strategy as the zen approach to binary options. Instead of chasing volatile movements, it focuses on trading during calm market periods using the ADX (Average Directional Index) and RSI indicators.
The ADX (Average Directional Index) + Horizontal Line
For this binary options strategy, the ADX indicator can help determine the level of market volatility. By applying it to a binary options chart, you can identify the least volatile periods when the market is considerably calm.
Firstly, adjust the indicator settings:
- Period: 20
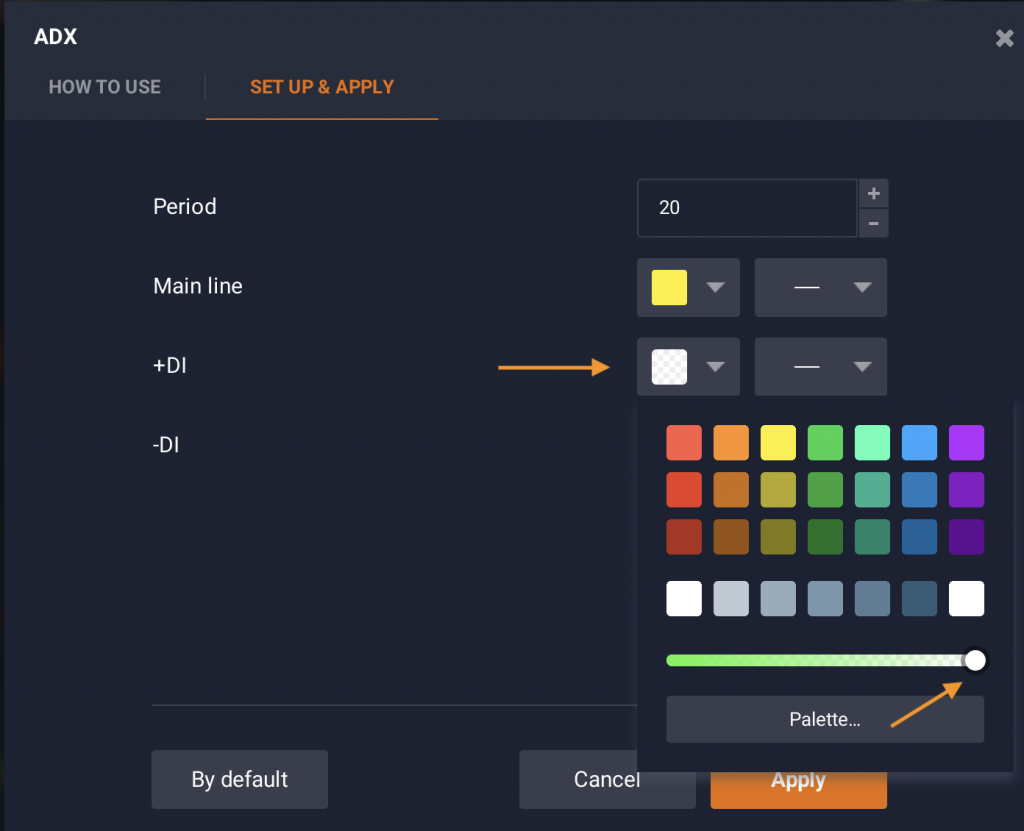
Normally, the ADX indicator has 3 lines. However, for this strategy, you only need to track the main one. You can make the other two supporting lines transparent, so they don’t distract you during the analysis.

Just shift the colour setting all the way to the right for the +DI and -DI lines in the indicator settings to make them invisible on the price chart.
Then, draw a Horizontal Line at the reading of ‘30’. When the main ADX line is found below our Horizontal Line, the market is adequately calm for trading with this binary options trading strategy.

The RSI
Similarly to the previous strategy, the RSI points to the overbought and oversold levels for a chosen asset. You can leave the default indicator settings for this binary options trading strategy:
- Overbought: 70
- Oversold: 30
✍️
If the RSI line gets closer to the level of 30, the asset could be oversold, hinting at a possible change to an uptrend.
ADX + Horizontal Line + RSI
For this strategy, you may look into opening a long position in the next 2–3 candlesticks when the following conditions are met:
- The RSI indicator points to the asset being oversold (the line is near the 30 level).
- The ADX hints at low market volatility (the indicator line is below the 30 mark).

A short position in the next 2–3 candlesticks may be considered when you notice these signs:
- The RSI indicator points to the asset being overbought (the line is near the 70 level).
- The ADX hints at low market volatility (the indicator line is below the 30 mark).

By avoiding volatility, this strategy helps you take advantage of steady, predictable price movements in a tranquil market environment.
3. Vortex simplicity: A strategy for quick decisions
The Vortex and TSI combo is one of the most straightforward and efficient binary options strategies, perfect for traders who prefer quick decisions. Named after the Vortex indicator, this strategy combines two complementary tools: Vortex and the True Strength Indicator (TSI). Together, they help you spot market trends and filter out unnecessary noise for clearer signals.
Here’s an overview of this binary options strategy set-up.
Vortex Indicator
This indicator consists of two lines: the blue uptrend line (VI+) and the purple downtrend line (VI-). This tool connects the highest and lowest points of the market’s price bars or candles, assessing trend direction and predicting potential reversals.

✍️
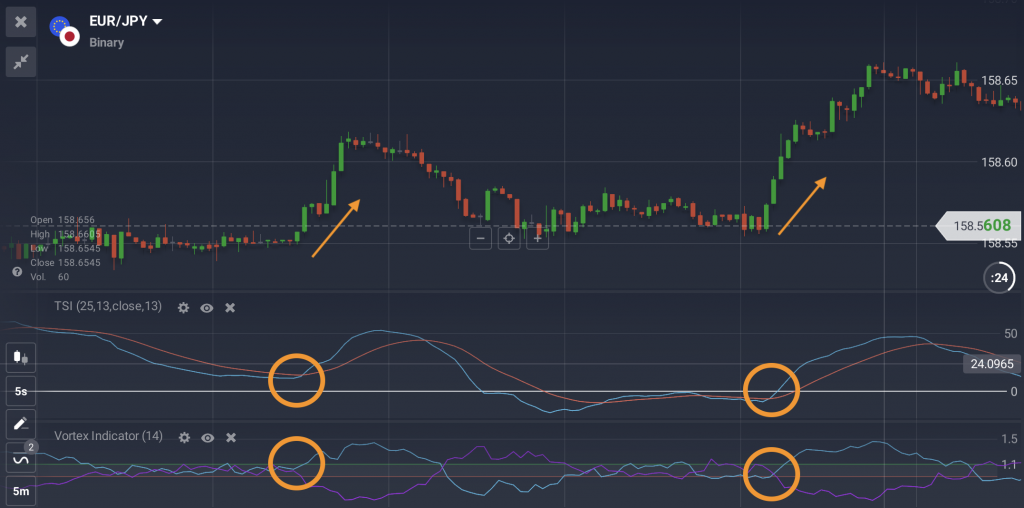
A bearish (SELL) signal occurs when the VI- is lower, and then it crosses the VI+ line from below.
True Strength Index (TSI)
This technical tool measures the strength of price movements to confirm trends. It consists of 3 lines: base line (white), signal line (red) and main line (blue). The True Strength Index points to overbought and oversold levels, as well as potential trend changes.

✍️
If the main line crosses the signal line from above and moves lower, it may signal a bearish reversal.
Vortex + True Strength Index
You may consider opening a BUY trade, when you notice the following:
- The blue lines on both Vortex and TSI cross upward, while the red lines cross downward.
- Watch for intersections in both indicators — either at the same time or one after another in a short period of time.

A SELL trade may be in order, when these signals occur:
- The red line of the TSI and the purple line of the Vortex cross upward, while the blue lines move downward.

The Vortex strategy’s simplicity and precision make it particularly suitable for beginners or traders looking for a one-minute timeframe setup. By focusing on clear intersections of indicator lines, this method ensures quick and decisive trades with minimal confusion.
Conclusion: Ready to transform your trading?
The binary options strategies outlined here offer a blend of simplicity and efficiency, ideal for traders seeking reliable setups. Whether you’re tracking market momentum with RSI or trading in calm channels using ADX, these methods can help you navigate the charts with clarity and confidence. Ready to discover even more game-changing strategies? Stay tuned for more strategies in the future.

