A lot of traders believe — and rightfully so — that candlestick patterns are important, as they can hint at an upcoming trend reversal and highlight a lucrative trading opportunity. However, putting too much faith into candlestick patterns can backfire. In today’s article we are talking about 3 candlestick patterns that don’t work as well as it’s popularly believed.
Harami
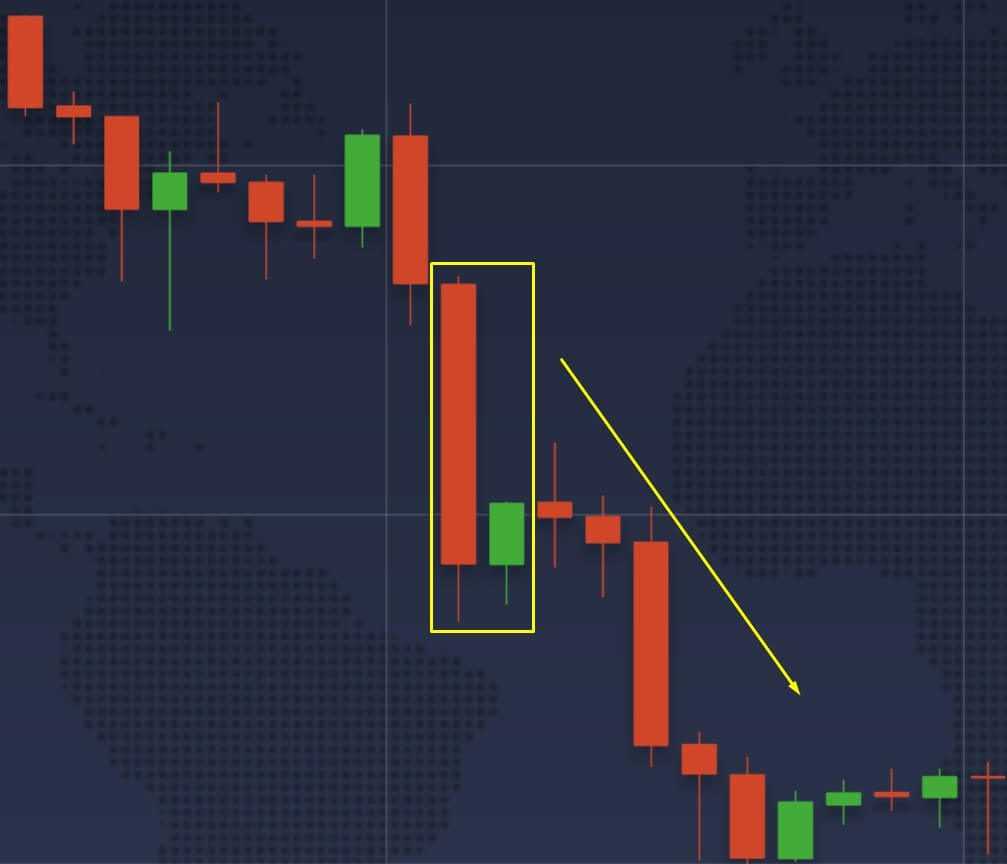
Harami (“pregnant” in Japanese) is a reversal candlestick pattern that can be observed for all asset types and time frames. Bullish Harami is a combination of two candlesticks: the first one closes lower than it opens, the second one closes higher than it opens. But more importantly, the second candlestick should perfectly fit inside the first one.
Harami advocates state that when this pattern is observed, the bearish trend has run out of its power and the market has come to a muted reversal. They, therefore, advise to BUY the asset after noticing a Harami.
In reality
Harami may or may not be an indication of the upcoming trend reversal. On the screenshot above you can see that a perfectly executed Harami pattern is no followed by a trend reversal. Quite the contrary, the negative trend still prevails and becomes even stronger.
Hammer
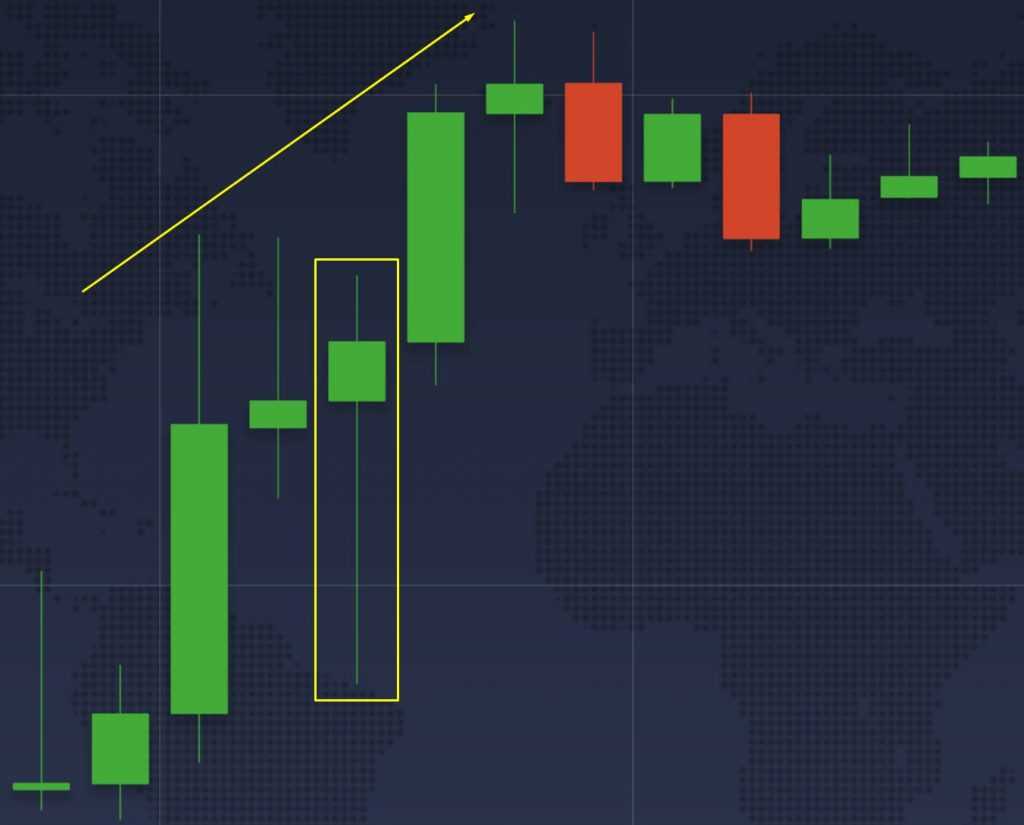
A Hammer is a one-candlestick trend-reversal pattern. It has a long shadow and a relatively short body located in the upper half of the candle. The color of the candlestick doesn’t matter. Certain experts believe that when a similar pattern is observed, the trend is about to change its direction. A negative trend will turn bullish after a Hammer. A positive trend, on the contrary, will start going down when a Hammer appears.
In reality
As if a pattern with only one candlestick was not suspicious enough, here is a good enough reason to not trust a Hammer: retracements. During a strong trend the price action will occasionally demonstrate reverse movements, that go against the direction of the general trend but only for a short period of time. Suchlike movements can appear on the chart as a Hammer. All in all, it is not a reliable way to predict trend reversals.
3 White Soldiers
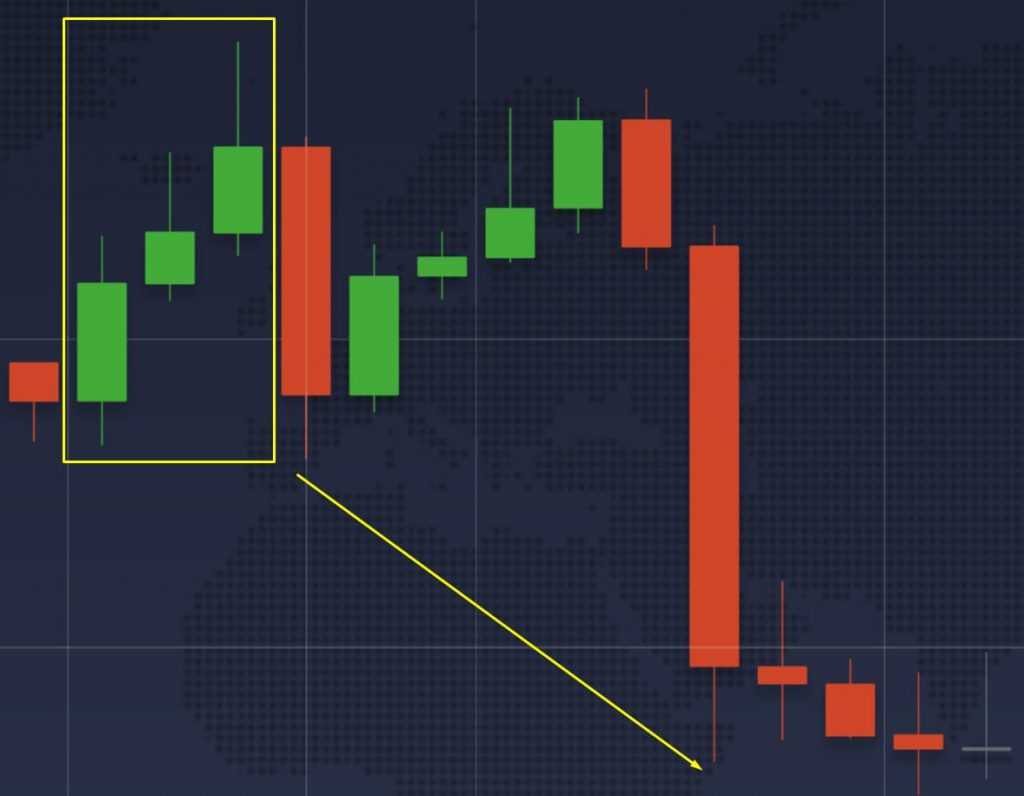
This pattern consists of three consecutive candlesticks, each of them opening and closing higher than the previous one. Conventional wisdom has it that you have to buy after the third candlestick of the pattern is complete. Many traders believe that if the trend demonstrates growth for three candles in a row, it will likely continue its upward movement. They are both right and wrong.
In reality
Even if the bullish trend is strong enough to demonstrate upward movement after the 3 White Soldiers, it can still turn negative at any given time. It is not that the positive trend cannot persists when 3 White Soldiers appear on the chart, it is that there is no connection between this pattern and the future direction of the trend. It can go up, down or remain flat.
Not all candlestick patterns are equally good, some have a higher chance of returning false signals. Avoid using the above-mentioned patterns without proper confirmation. Use other pattern and technical analysis tools before opening a deal. And remember, no pattern can be 100% accurate.


