
The Commodity Channel Index, also known as the CCI indicator, was created in the 1970s but still remains a top technical analysis tool. Initially used to analyze commodity markets, it is now applied to most assets, including forex, stocks, crypto, etc. When the CCI indicator is used for trading, it may determine the strength of the trend and its direction to locate possible entries and exits.
How to Read the CCI Indicator?
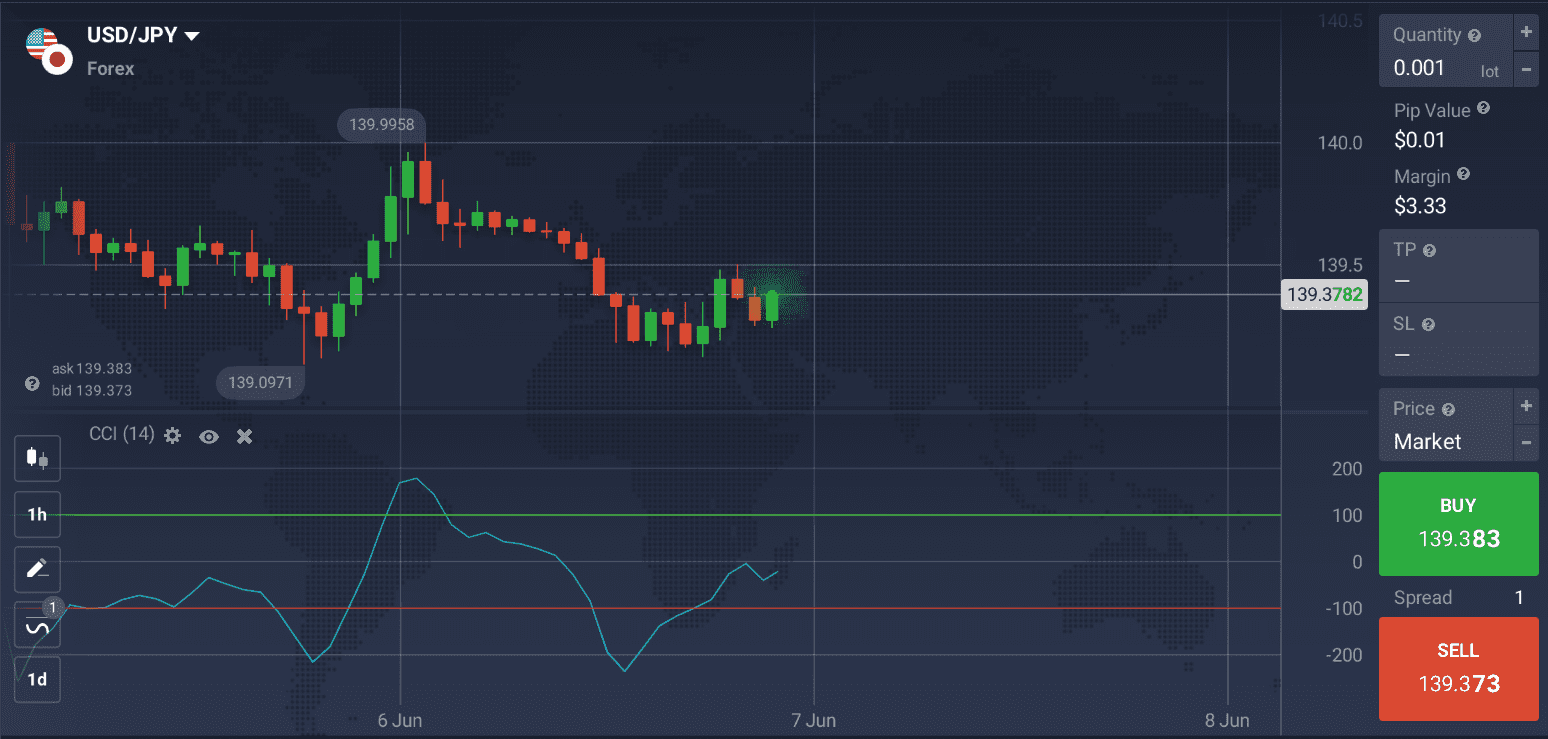
The CCI indicator data is based on the difference between the current asset price and the historical average figures. Basically, when the CCI line is above 0, the current price is higher than the historic average price. If the indicator line moves below 0, it’s lower than historic figures.
Donald Lambert, who came up with this indicator, assumed that price fluctuations follow certain intervals. Whenever the price goes beyond these normal intervals, there is a high chance that it will bounce back shortly. If traders choose to open a deal at this moment, it is because they expect the price to potentially get back to the original interval soon.
☝️
0 to 100. When the CCI indicator is moving upward from 0 closer to 100, a bullish trend (uptrend) may be observed. At this point on, a potential pullback may be seen (when the price bounces back to the previous level). Pullbacks are generally considered a potential entry opportunity.
0 to -100. In case the CCI line shifts from 0 closer to -100, it might point to a bearish trend (downtrend). Some may consider this as a chance to open a short position (SELL).
Keep in mind that the Commodity Channel Index is not bound by any specific values. This means that it can go higher or lower without any limits. So traders need to take that into account when learning how to read the CCI indicator and making trading decisions based on its data. As no one indicator can guarantee 100% accuracy, it may also be a good idea to confirm your analysis using other technical tools.
CCI Indicator Settings
When it comes to the CCI indicator settings, there are 2 main values to consider when customizing this tool for your trading goals. They are the Period and the Overbought level.
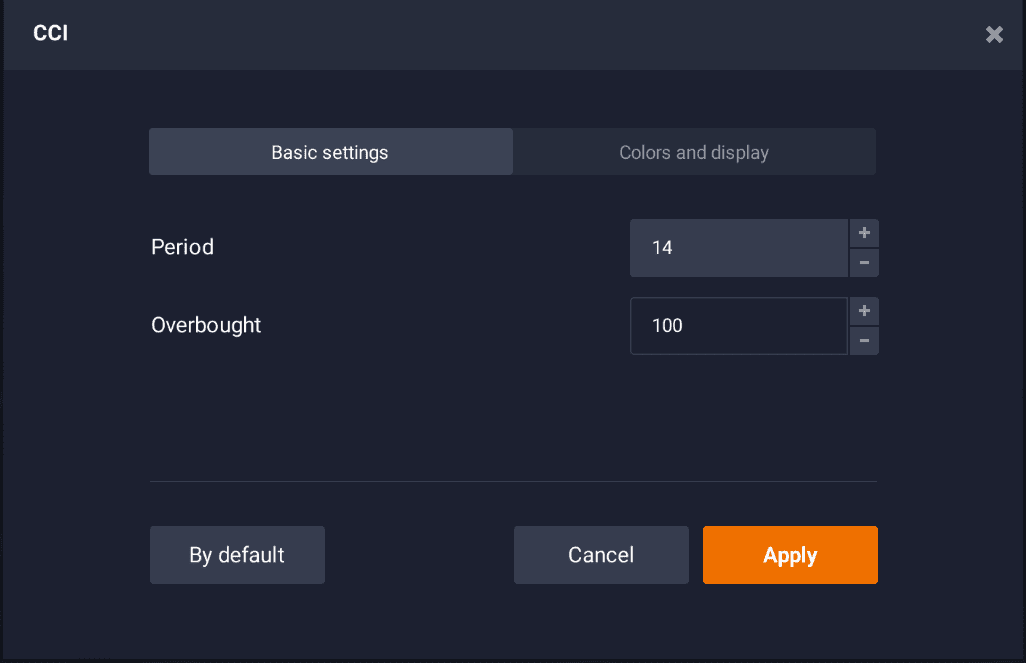
It’s possible to use the default settings offered in the IQ Option traderoom as indicated in the image above. However, you may also adjust the CCI indicator settings according to your trading approach.
How may CCI Indicator be used?
There are two basic approaches to using the CCI indicator for trading.
Example of a Long Position
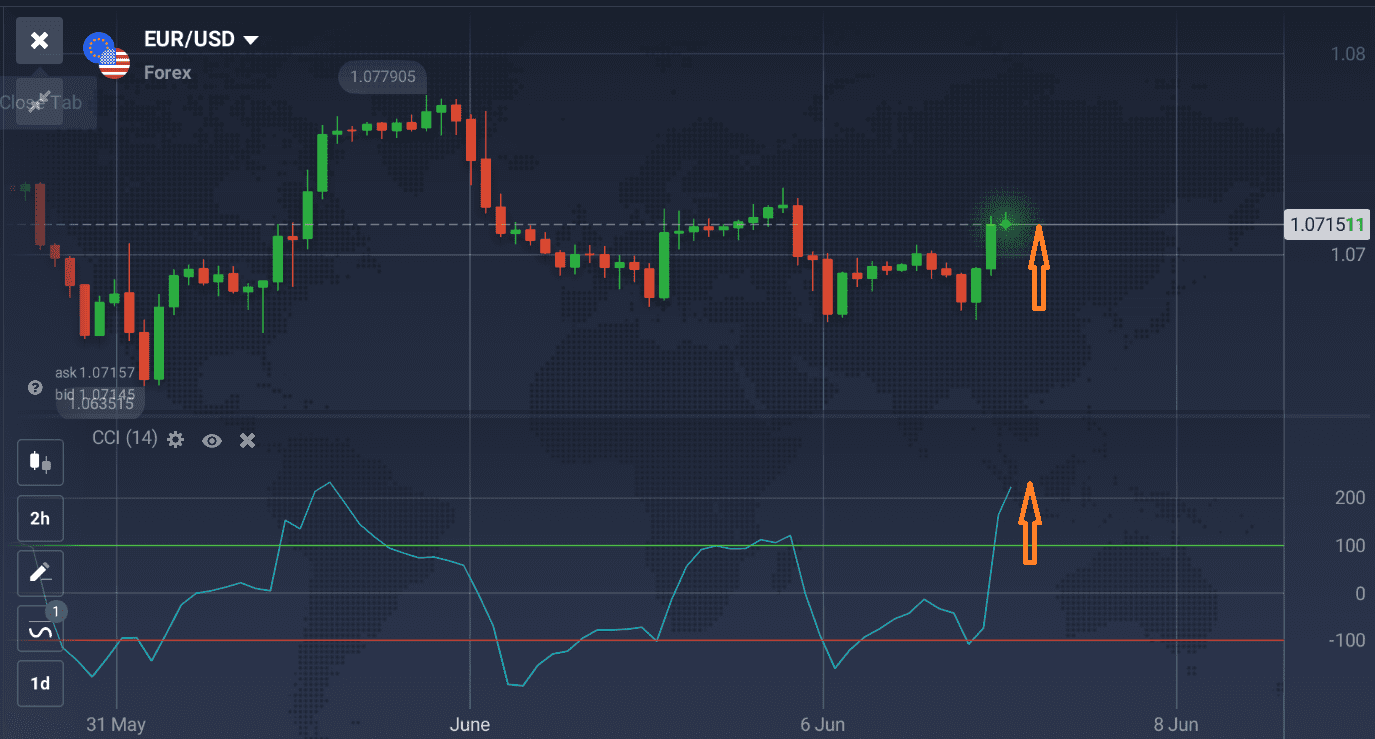
When the CCI indicator line crosses +100, it may indicate that the market is bullish. This might generally be the moment when some traders may consider opening a long (BUY) position.
Example of a Short Position
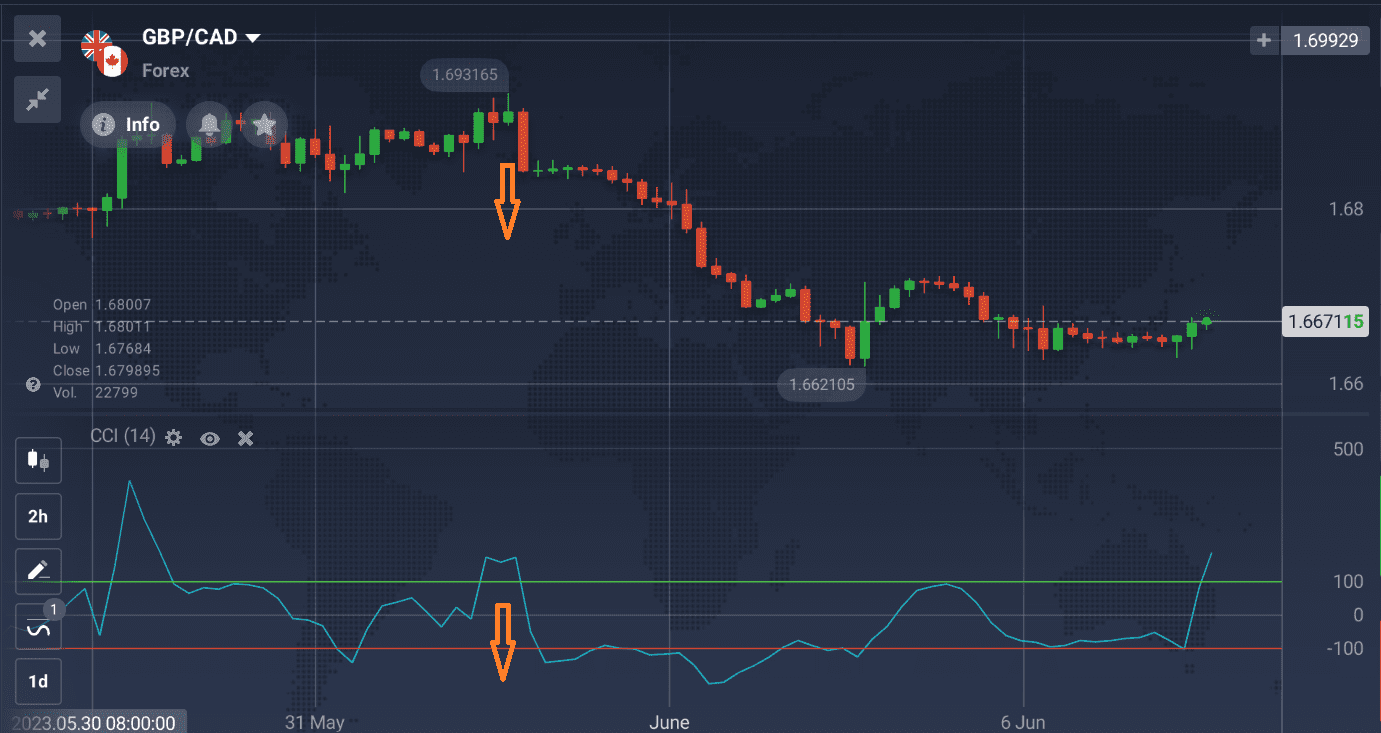
When the CCI line crosses -100, it might point to a downtrend and, therefore, may be interpreted to look for entries for a short position (SELL).
As this indicator isn’t bound by fixed values, you may want to analyze the past performance of the traded assets. This may help you find the reversal patterns for specific assets and use this information to locate potential entries. For instance, some assets may tend to reverse after reaching the +150 in uptrend and -200 in downtrend. Take a look at the image below demonstrating that this asset’s price used to reverse around 200.
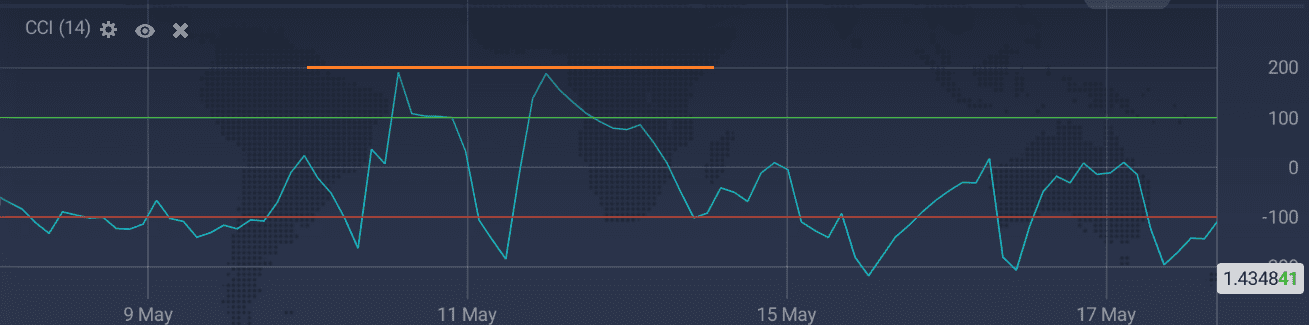
Bear in mind that past performance is not an indicator of future performance, so any conclusions traders make should be confirmed by additional data.
Divergence
Sometimes the price might behave differently and move in the opposite direction of the indicator line. This is called divergence, and may cause some confusion in looking for potential entries. In case of the Commodity Channel Index, divergence may point to a weakening trend.
In Conclusion
The Commodity Channel Index (or CCI indicator) is an effective technical analysis tool that may be used as part of different trading approaches. It may help evaluate the direction of the trend and locate potential entry and exit points for both long (BUY) and short (SELL) positions for a variety of assets. Once you learn how to read the CCI indicator and apply its data to price charts, you may enhance your trading method and approach.
