
There are dozens of technical indicators for Forex trading that may help identify market trends, point to upcoming reversals and determine oversold or overbought levels. Having this information may be critical for making trading decisions. So it’s very important to pick the most effective Forex trading indicators for optimal results.
In this article, we’ll take a look at 5 popular technical indicators for Forex trading and possible combinations. By learning about these tools and testing them, you can select the most suitable instruments for your trading approach.
The Moving Average
The Moving Average is a simple tool that many traders use in their technical analysis for Forex market. It is a trend-following indicator. The main goal of the Moving Average is to determine the trend direction (upward or downward).
✍️
When the price chart crosses the Moving Average line from below, it may point to an upward trend. On the contrary, if the price chart crosses the Moving Average line from above, it might indicate a downward trend.
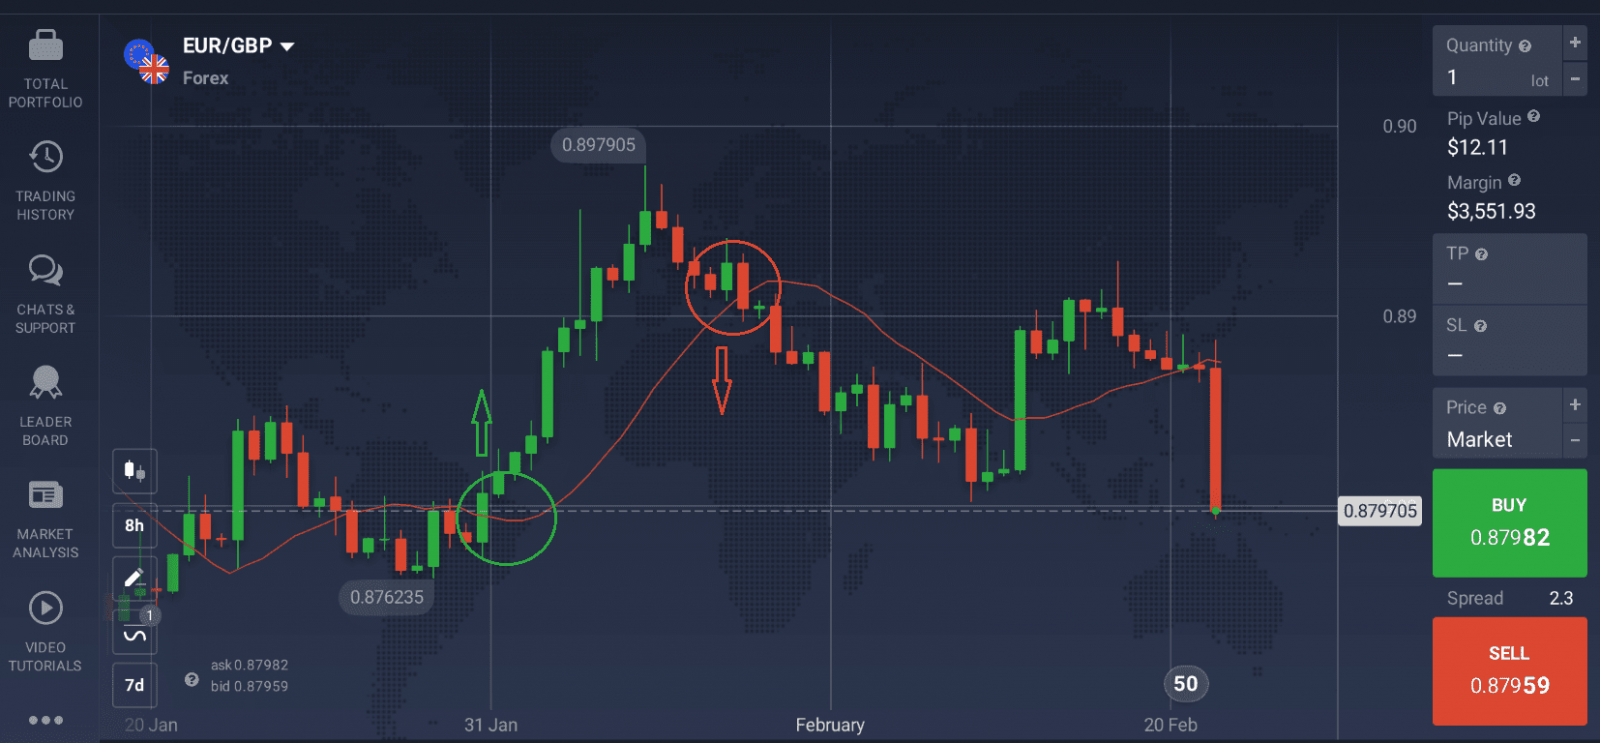
The Moving Average may be used on its own and in combination with most types of technical indicators for Forex trading.
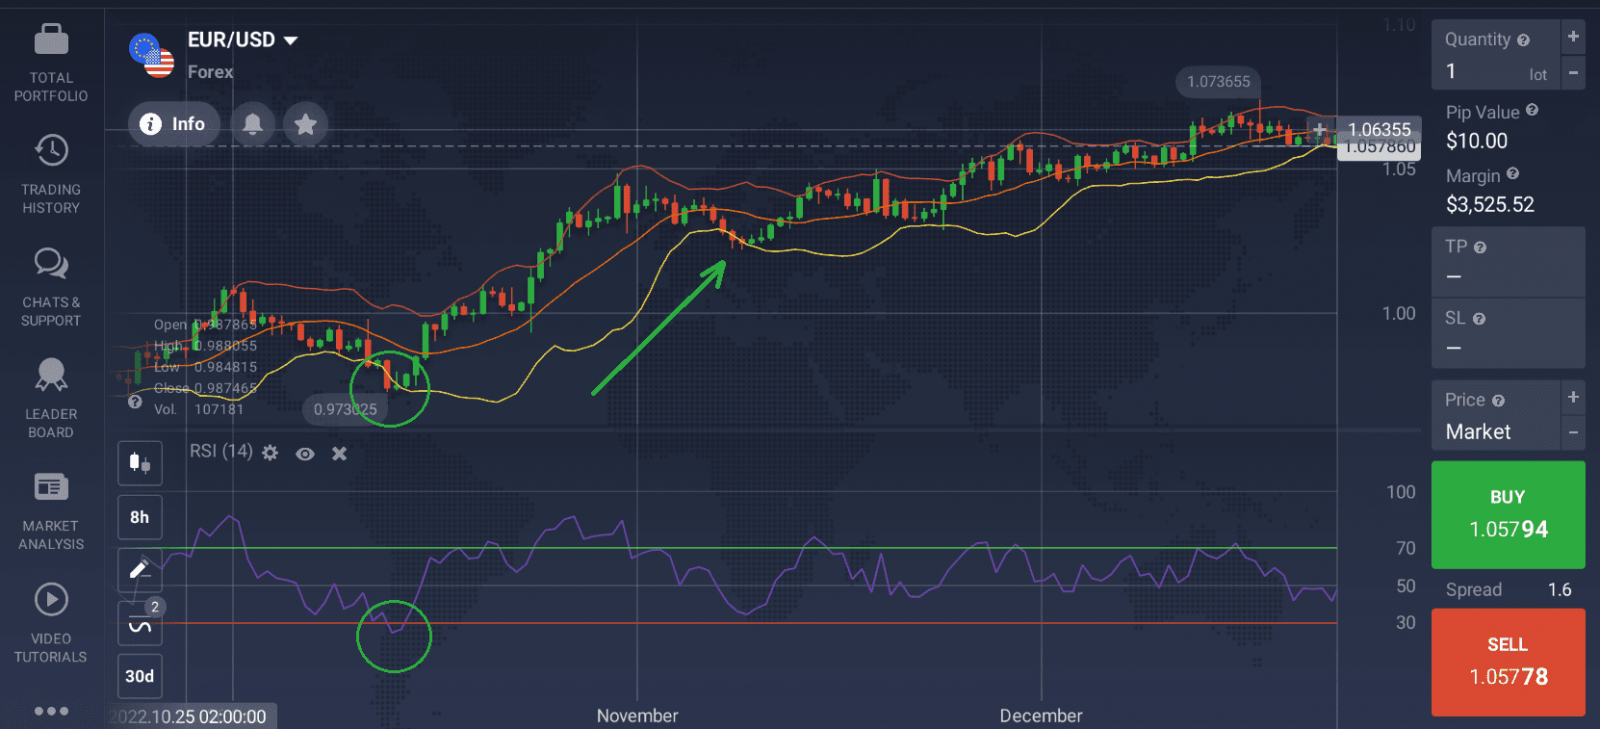
Bollinger Bands
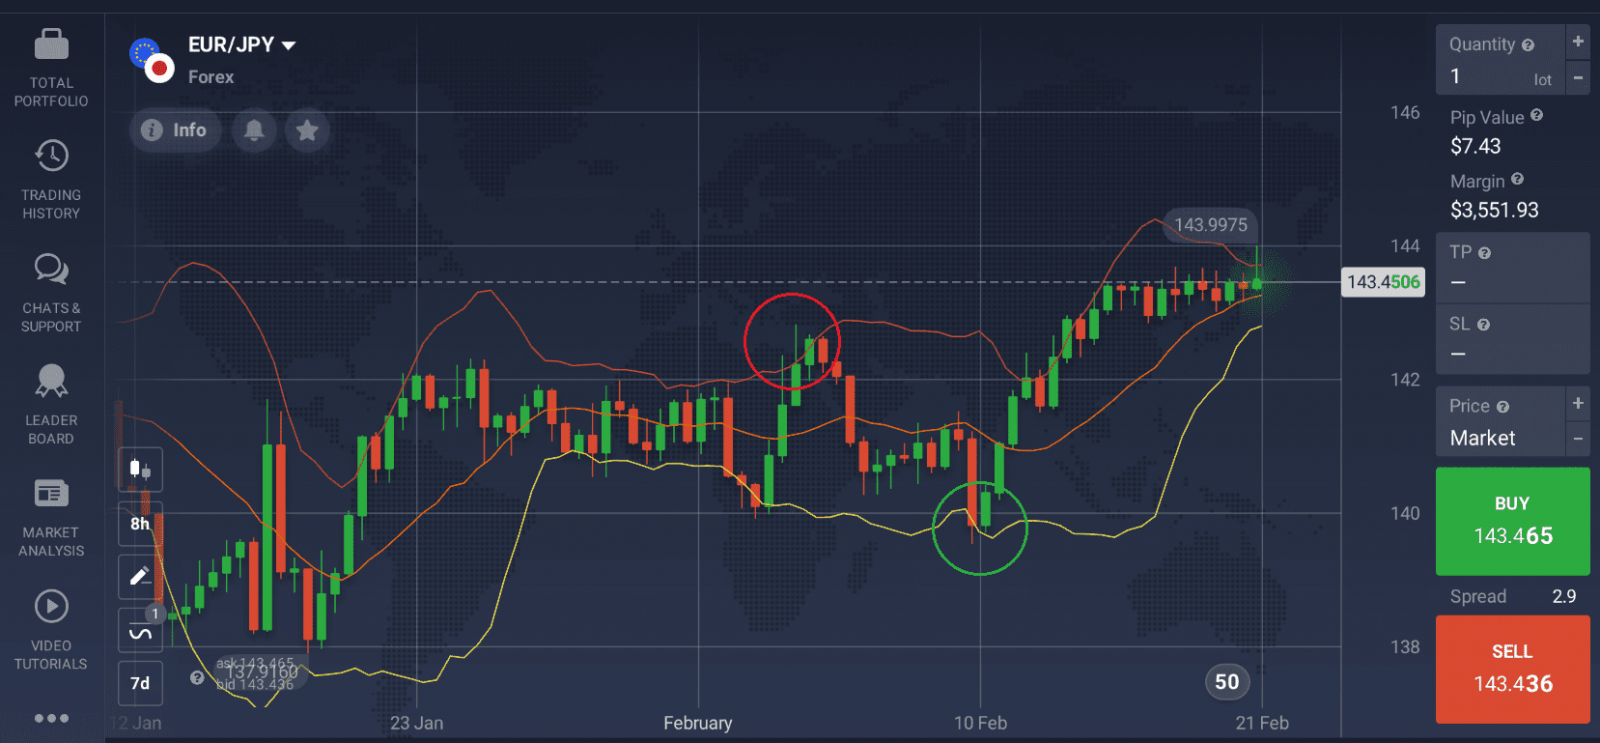
The Bollinger Bands indicator consists of 3 lines: a simple Moving Average (orange) and 2 bands (red and yellow) that appear above and below the Moving Average line. Its purpose is to determine the overbought and oversold levels, which may indicate an upcoming trend reversal.
✍️
If the price chart reaches the top band, it may indicate that the asset is overbought. This may be followed by downward movement.
Conversely, if the price chart gets closer to the lower band and touches it, this might suggest that the asset is oversold. In this case, the price may turn upward.
A trend reversal may occur when the candlesticks of the price chart cross the Moving Average line.
The Bollinger Bands may not be the most effective Forex trading indicator if applied on its own, but it might be quite useful combined with other tools, such as the RSI.
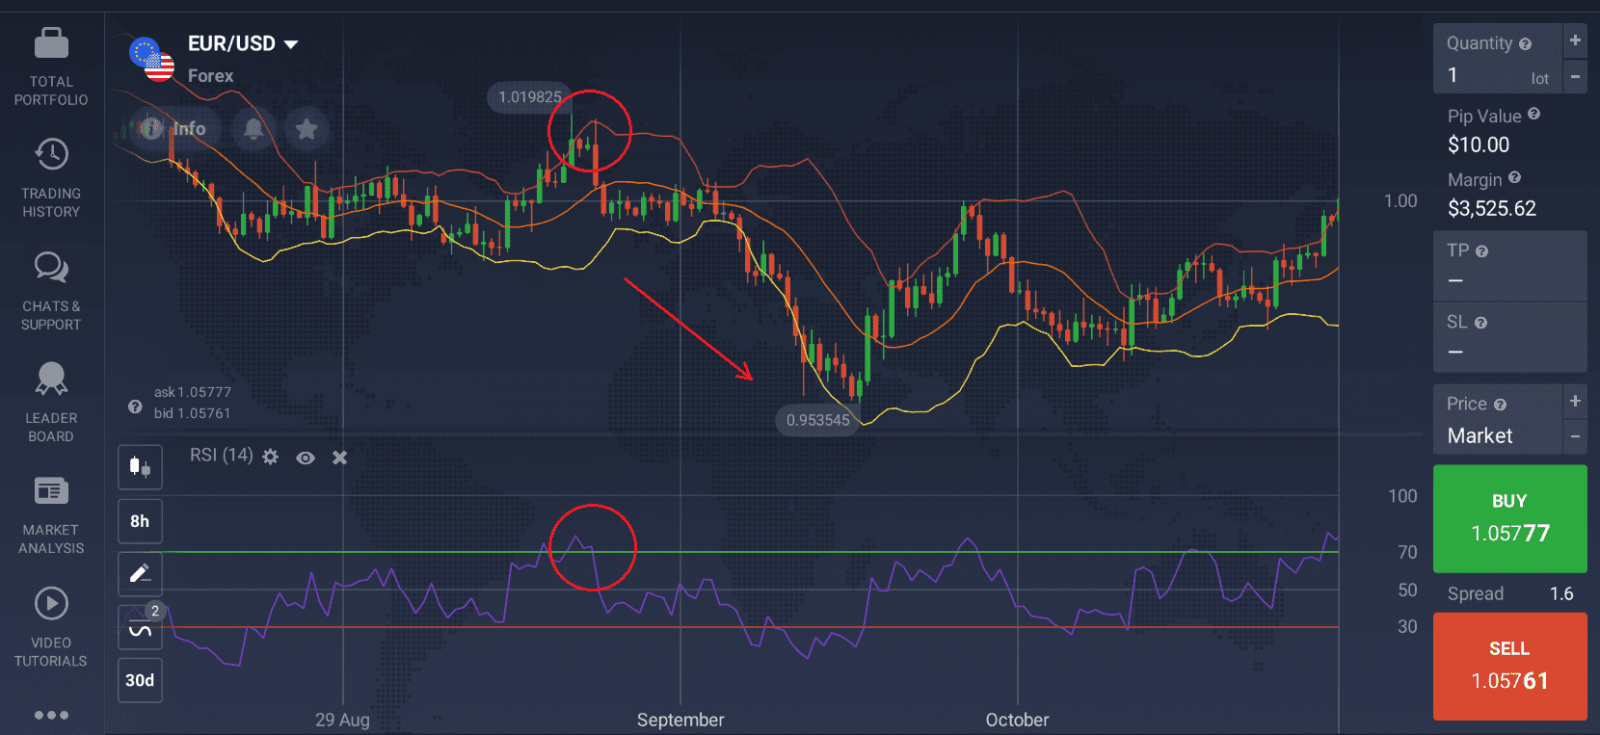
The Relative Strength Indicator (RSI)
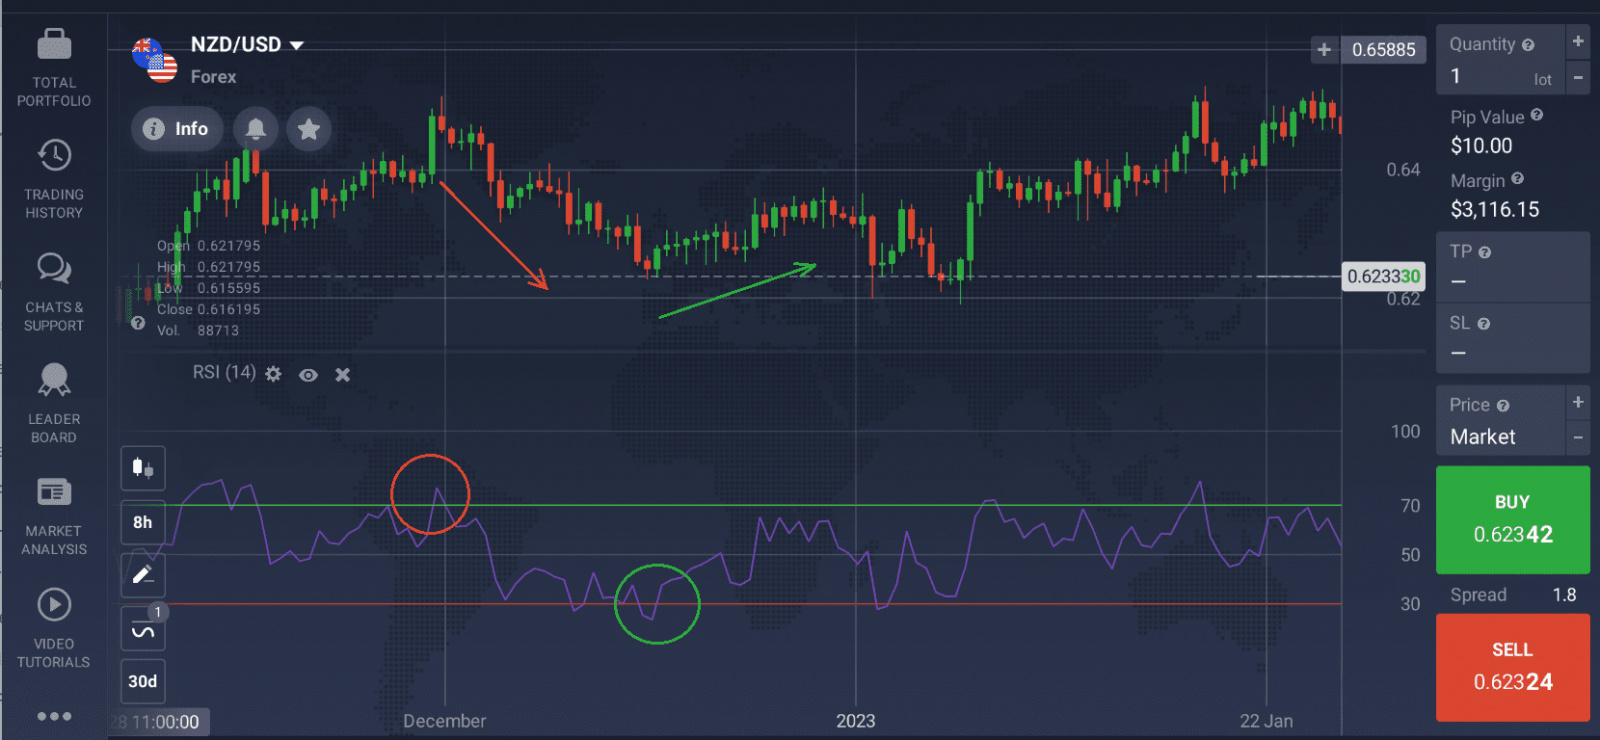
The RSI is an oscillator that might help traders asses the trend strength and spot potential reversals. It moves on a scale from 0 to 100, providing information about the overbought and oversold levels.
✍️
The asset may be considered overbought, if the RSI base line moves above 70. At this point, traders might expect a bearish trend to follow, with the price going down.
On the contrary, whenever the RSI line crosses 30, the asset might be viewed as oversold. That is when traders may anticipate a reversal to a bullish trend.
The Average True Range (ATR)
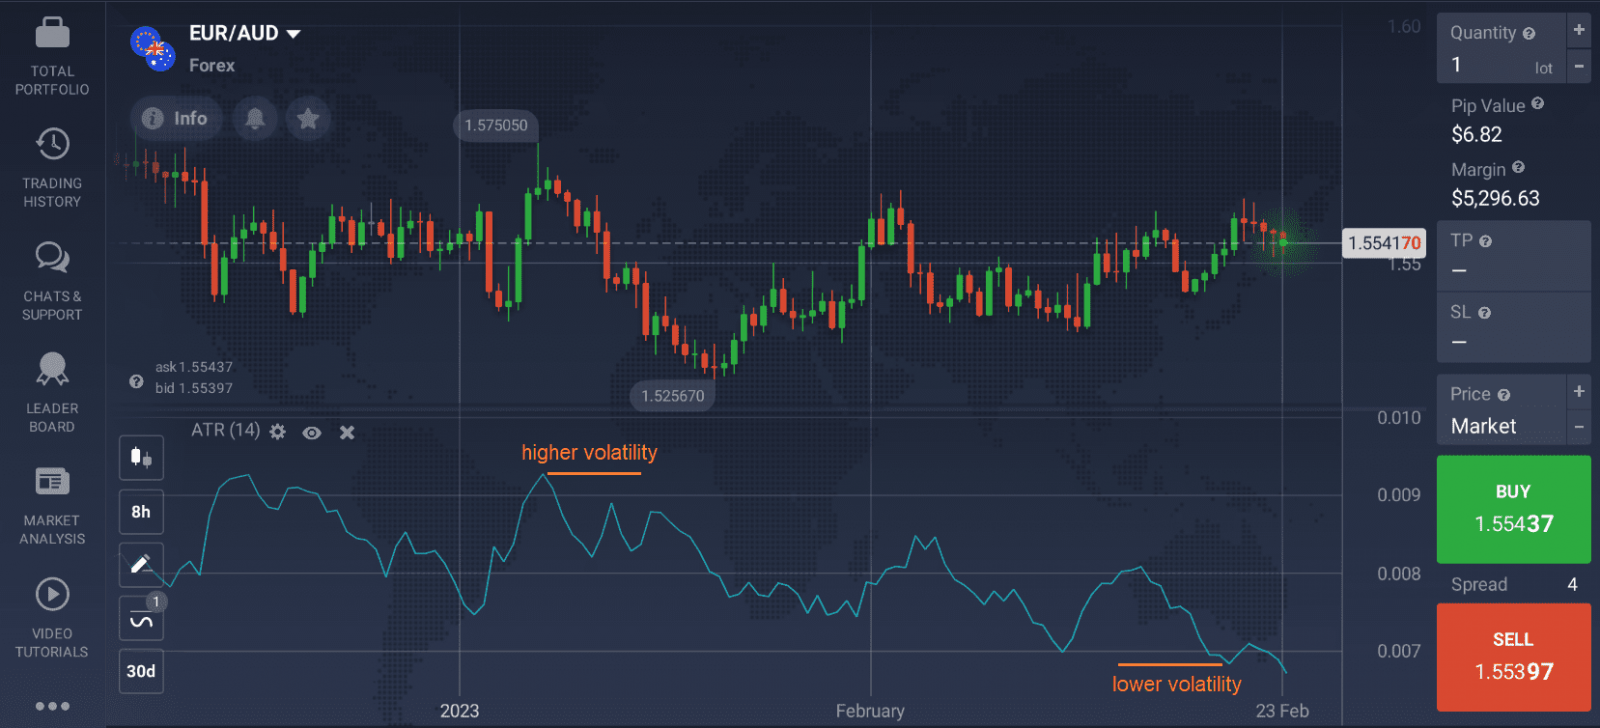
The ATR indicator is an effective tool commonly used in technical analysis for Forex market. It may assist traders in measuring market volatility – an important factor in determining whether the current trend will continue.
✍️
When market volatility is increasing, the ATR line goes up. As price changes following higher volatility may offer new trading opportunities, some traders might see this moment as such an opportunity.
If market activity is decreasing, the ATR line will go down accordingly. Once traders learn to assess the market volatility, they may be able to choose the optimal entry and exit points.
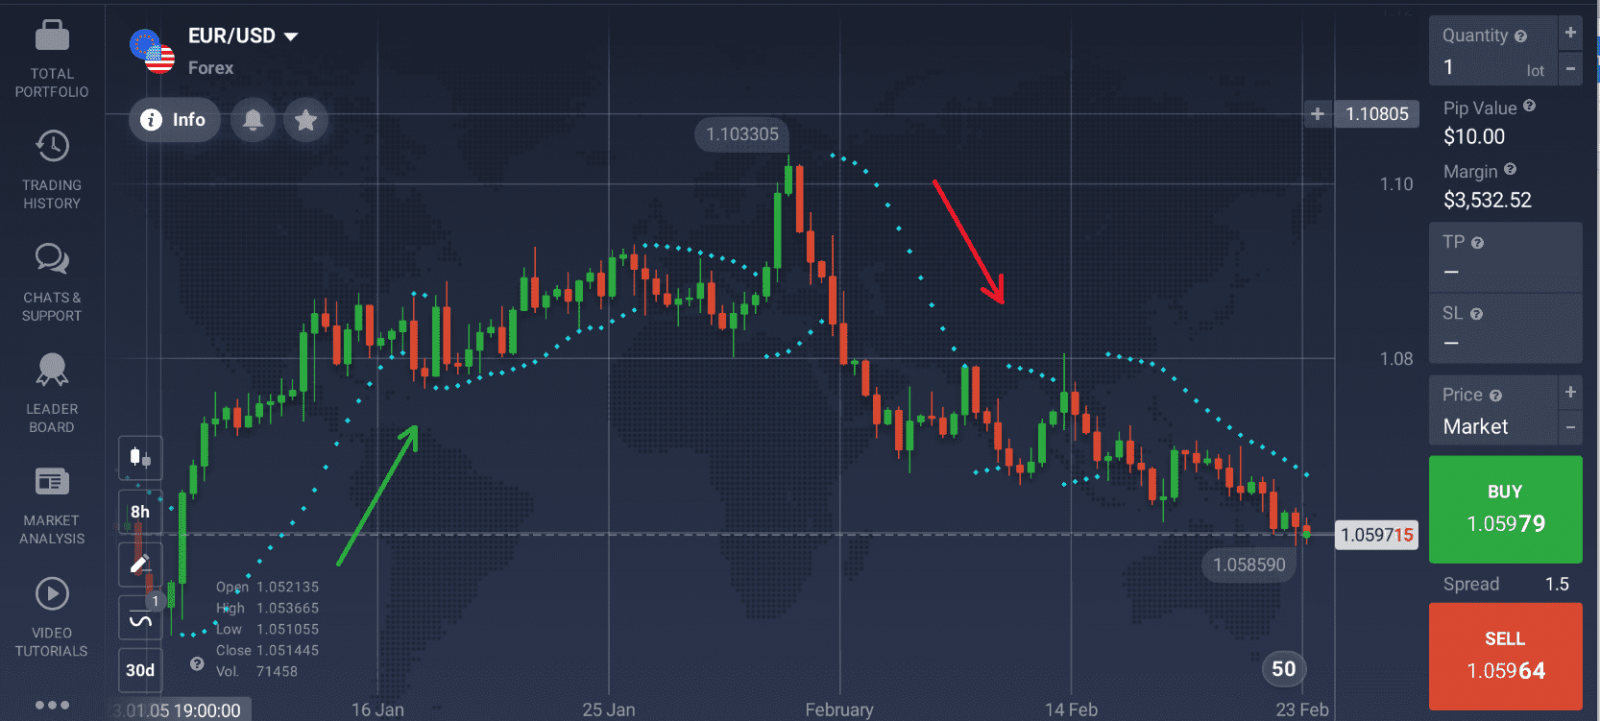
Parabolic SAR
This indicator’s main purpose is to help determine the trend direction and point to potential reversals. It is displayed on the price chart as a series of dots below or above it.
✍️
If the Parabolic SAR dots are above the price chart, it may indicate a following bearish trend. Once the dots move below the chart, an upcoming bullish trend might be anticipated. Having this information may offer some insights into assets’ price movements and point to trading opportunities.
The Parabolic SAR may also offer additional insights into Forex market activity when used in combination with other indicators, such as the Moving Average.
How to Combine Best Technical Indicators for Forex Trading?
There are quite a few Forex indicators that work well together. Applying several tools at the same time may offer more accuracy and provide additional information about asset prices. Here is an example of a popular Forex indicator combo.
RSI + Bollinger Bands
Combining these 2 technical indicators might help traders find the appropriate moment to open a long (BUY) or a short (SELL) position depending on their preference.
If the price chart crosses the lower line of the Bollinger bands, while the RSI crosses the oversold level and moves upward, it may indicate a bullish trend.
Once the candlesticks reach the top line of the Bollinger bands with the RSI at the overbought level, it might signal a bearish trend.
Keep in mind that no technical indicator for Forex trading or their combinations can offer 100% accurate results, so make sure to apply the appropriate Stop-Loss and Take-Profit levels to manage your trades.
