
To experienced traders and investors, candlesticks are not just colourful sticks and lines. They represent the actual footprints of the price action. They are not random, as they reflect the changes in the market, all the activity of buyers and sellers. Reading the most used candlestick patterns may help to better understand the price formation and track market cycles and patterns.
These 6 most used candlestick patterns might become a useful addition to any trading approach. They are also a universally applicable tool, offering valuable insights into different assets, such as CFDs on Stocks, Forex or Crypto. If you aren’t familiar with the concept of candle patterns, have a look at this detailed material: Trading with Candlestick Patterns.
Three White Soldiers and Three Black Crows
These two patterns might point to a possible reversal after a strong trend. Their poetic names are based on the visual appearance of the patterns on the chart.
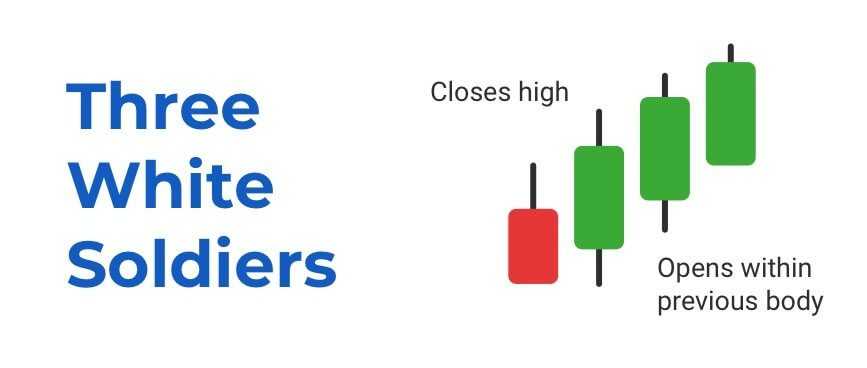
Three White Soldiers are three green candlesticks that appear after a substantial market decline. Each of them opens within the previous candle body and closes near its high point.
They resemble a staircase going up and in case of a confirmation, the trend may continue climbing. In such cases, indications for potential long positions may be visible following the Three White Soldiers pattern.
Three Black Crows is the opposite: the three red candlesticks are opened within the previous candle body and close near its low point. This pattern starts near the high of an uptrend and may point to a continued drop to lower levels. The next candle might indicate whether the price may continue following the new trend. In case of a confirmation, it may point to a potential opportunity to open a short position.
Doji
In Japanese, “どじ” pronounced as “do-dji” means “a blunder” or “mistake”. The chart pattern itself may suggest some sort of irregular behaviour on the market, which is why it received this name. It looks like a cross or a plus sign on the chart. And it essentially shows that the opening and closing prices were the same.
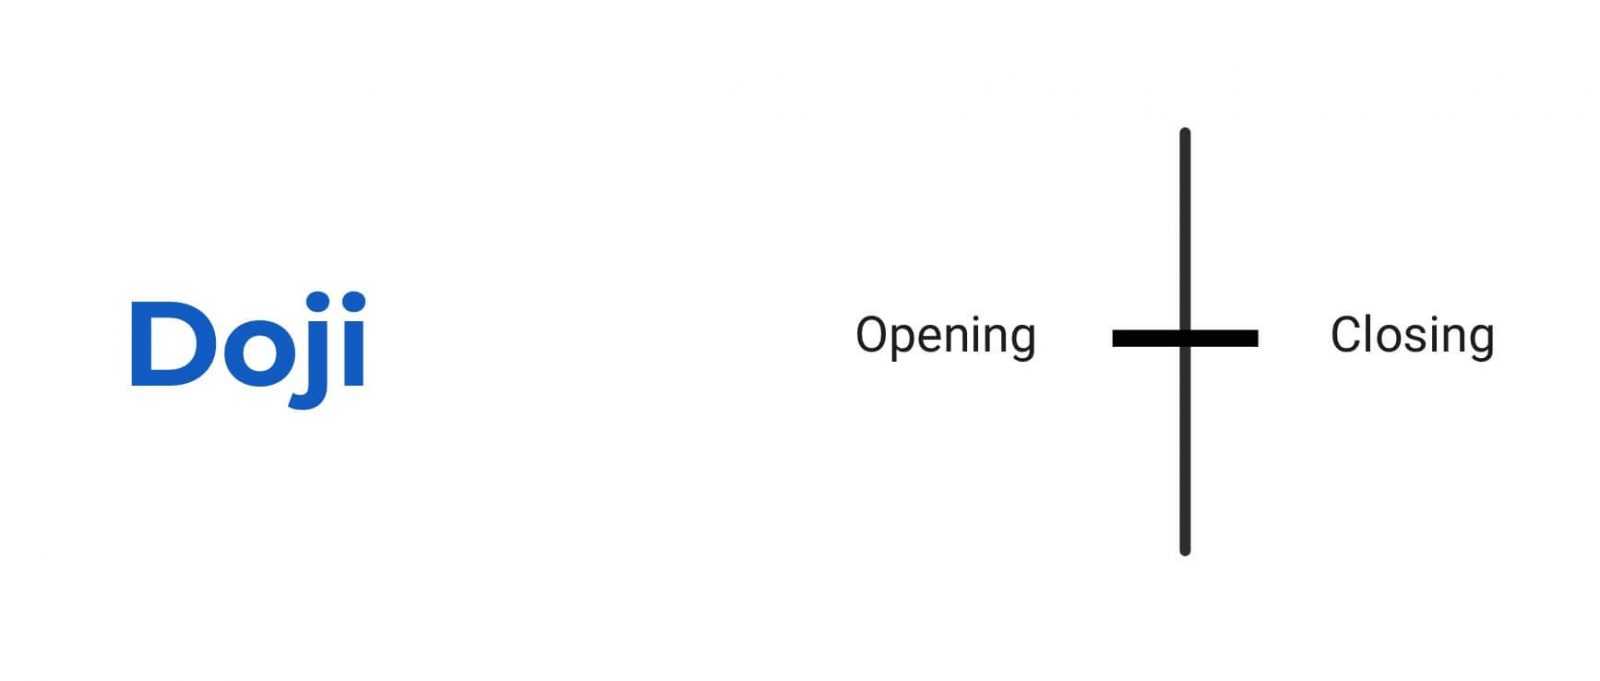
One may see Doji during periods of consolidation. Such behaviour of the price reflects the indecision on the side of buyers and sellers.
When such a candlestick appears, it may be a sign of an end of the ongoing trend. This might be followed by a potential reversal. However, on its own, it does not necessarily confirm a reversal. So a trader needs to be attentive and utilize other tools to help analyse the market condition. Doji may also be an indication to observe the market and avoid entries during the time of uncertainty.
The Hammer
Initially, a Hammer may look like a Doji, but they are different. A Hammer has a small body and a long shadow. It can be found after a market decline. It shows that during the period of selling, buyers had pushed the price up again.
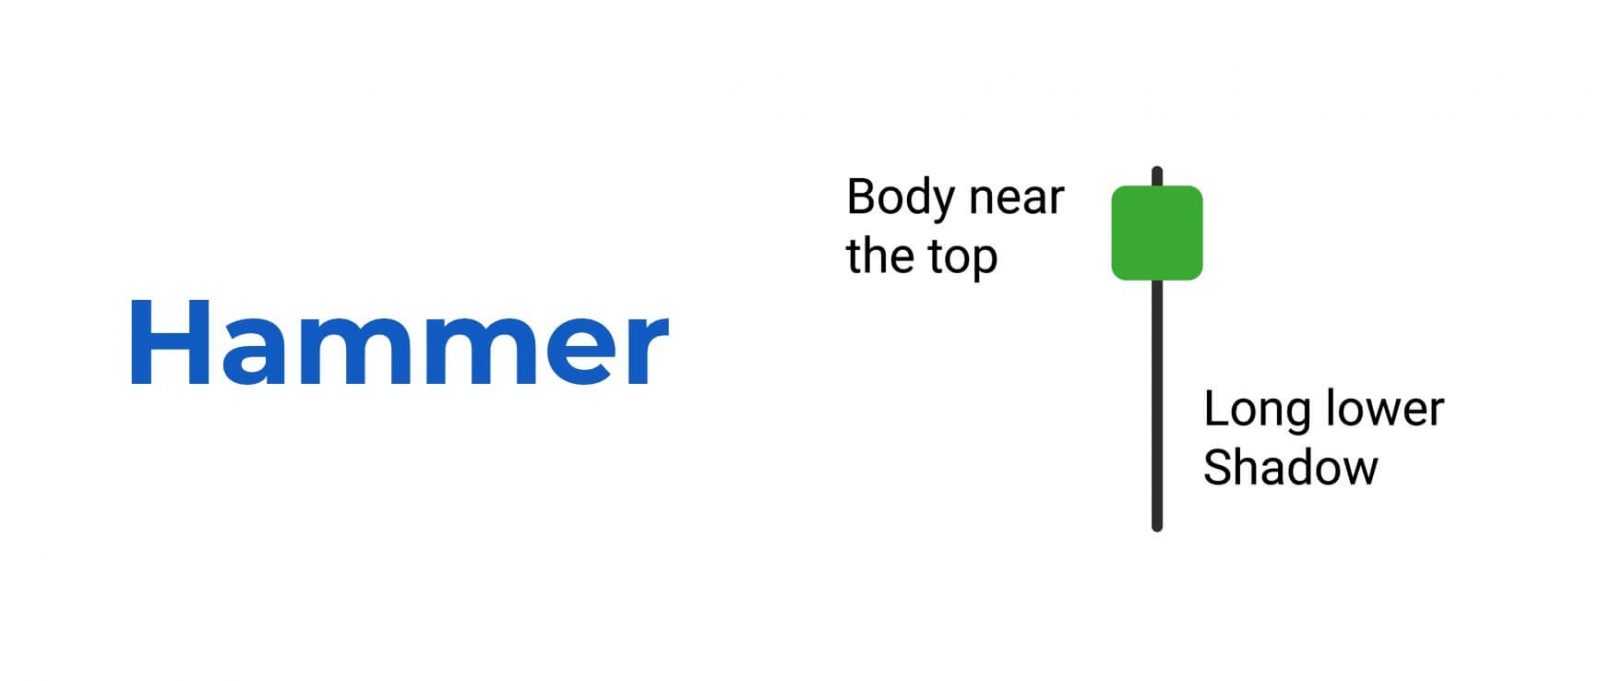
If the price keeps rising after the Hammer pattern appears, it may indicate potential buy opportunities. Note that the colour of the candle is not relevant. The Hammer can be green or red, what matters is that it forms after a downtrend.
An identical formation that appears after an uptrend is called the Hanging Man. The idea is the same, but reversed. If it appears at the end of a bull run and the trend after this formation continues decreasing, it may be an indication of a downward trend. However, keep in mind that even the most used candlestick patterns may not offer 100% correct indications. So it’s up to the trader to interpret the trends and apply the appropriate risk-management tools to protect their capital.
Morning Star and Evening Star
Both of these patterns involve three candlesticks. The middle candlestick is called the “star” as it does not overlap with the body of the preceding candle. Instead, it stands away from it, forming a gap. These patterns are commonly found on assets with a bigger timeframe and not on intraday charts (though it may still appear on shorter timeframes, too).
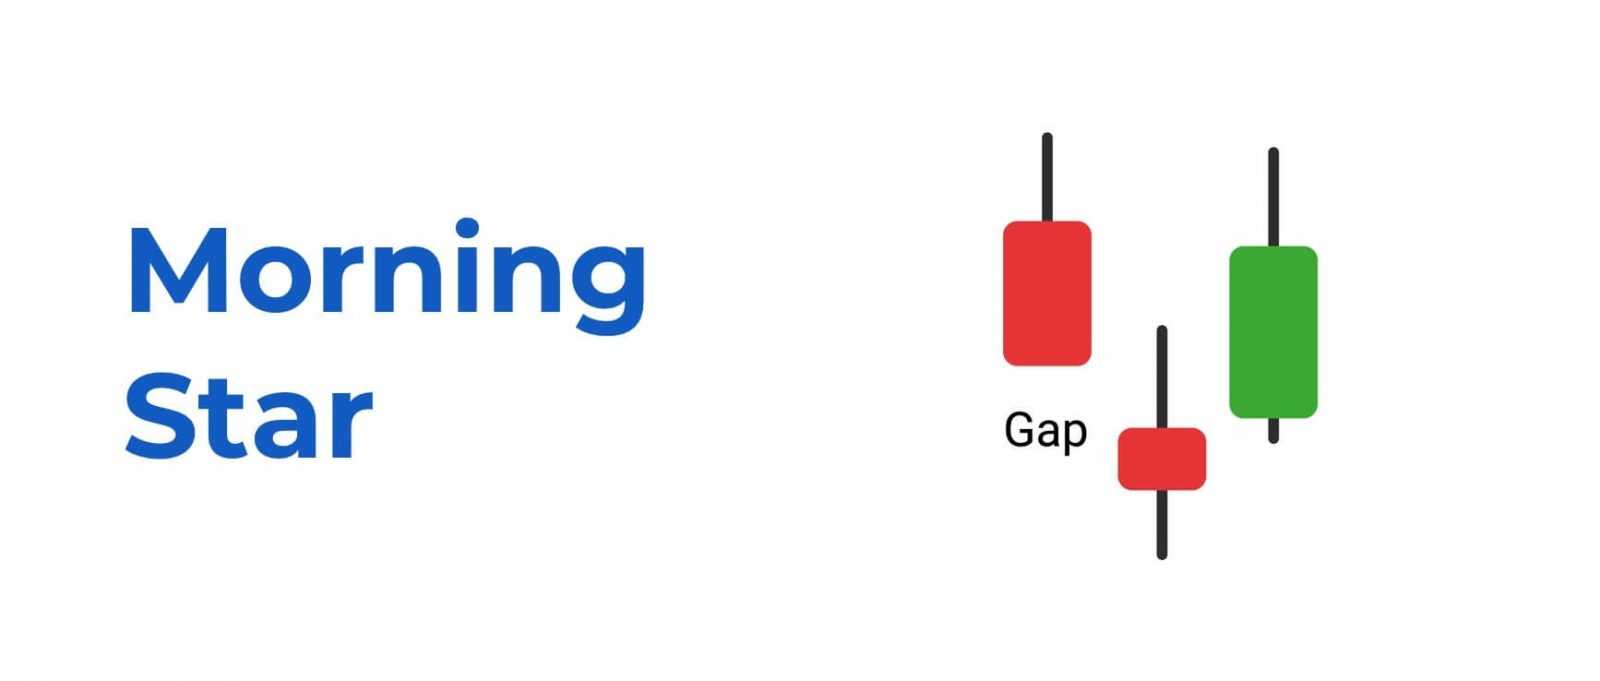
The Morning Star consists of a long bearish candlestick, followed by a “star” below it (either bullish or bearish) and a bullish candlestick that closes within the body of the first candlestick. It might indicate a possible opportunity to open a long position following this pattern.
The Evening Star is represented with a long bullish candlestick, a star above it (either bullish or bearish) and a bearish candlestick that closes within the body of the first candlestick. Some traders may consider opening a short position following this candle pattern.
These six most used candlestick patterns are just some basic examples that might be useful for traders with different levels of experience. With that said, candlestick formations do not guarantee of successful predictions, and they do not always provide 100% correct indications. So, traders must apply suitable risk management techniques to manage their capital and achieve their financial goals.
