Candlesticks are arguably the most popular chart type among traders. They combine the data from various timeframes and present it in a convenient way. In comparison to the standard line chart, the candlestick chart gives traders the possibility to track similarities in price formation and notice repetitions. Chart pattern trading is based on spotting similar patterns of candlesticks, which may show the direction in which the trend might move next.
There are dozens of candlestick patterns that traders regularly use. Today we will look at four popular ones: the Harami cross candlestick pattern, Head and Shoulders, Doji and the Hanging Man. These patterns can potentially help traders catch trend reversals and enter new positions in a timely manner.
Hanging Man
The Hanging Man is a popular trading pattern in technical analysis, typically used to identify potential trend reversals in financial markets. The pattern forms when a candlestick shows a long lower shadow with a small body at the top, resembling a hanging man. It is sometimes compared to the Hammer pattern, but the difference is in the context in which the patterns occur.
The Hanging Man pattern can typically be spotted after an uptrend, indicating that a bearish trend may start soon. The Hammer pattern forms after a downtrend and indicates a bullish reversal.
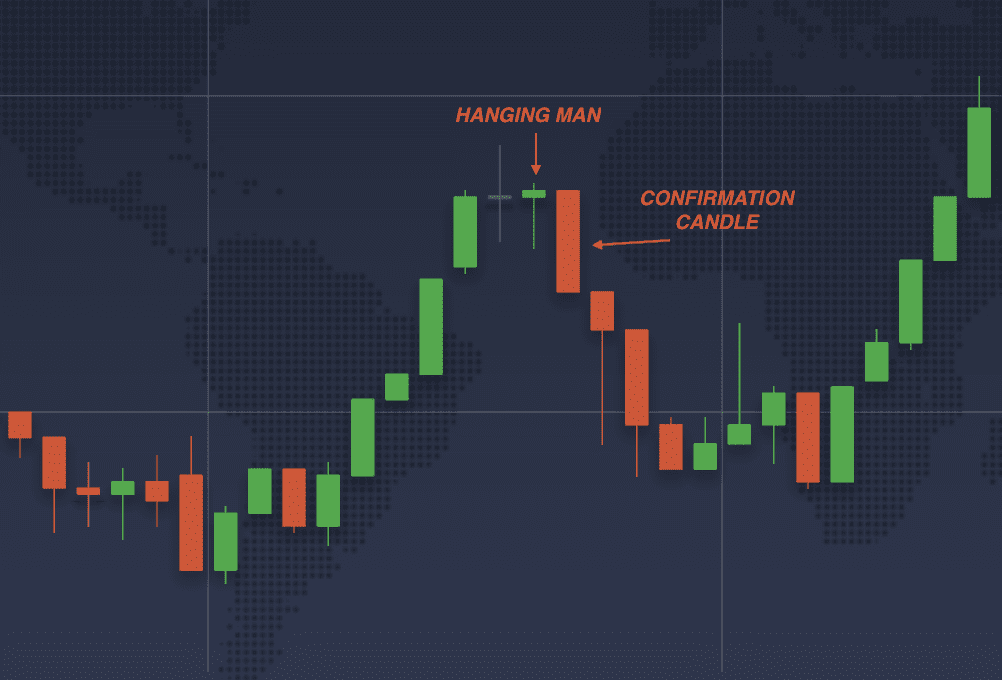
How to spot the Hanging Man pattern:
- The pattern usually occurs after an uptrend.
- A candlestick with a short body and a long lower shadow (and sometimes a short upper shadow) is formed, indicating that the bullish trend is losing momentum.
- The following candle indicates that the price is declining, confirming the reversal.
Head and Shoulders
Like many other candlestick patterns, the Head and Shoulders is named after the shape that it resembles. This pattern is a formation that can be seen when viewing the chart on longer timeframes. With two smaller peaks forming on each side of a larger peak, this shape looks like a head between two shoulders.
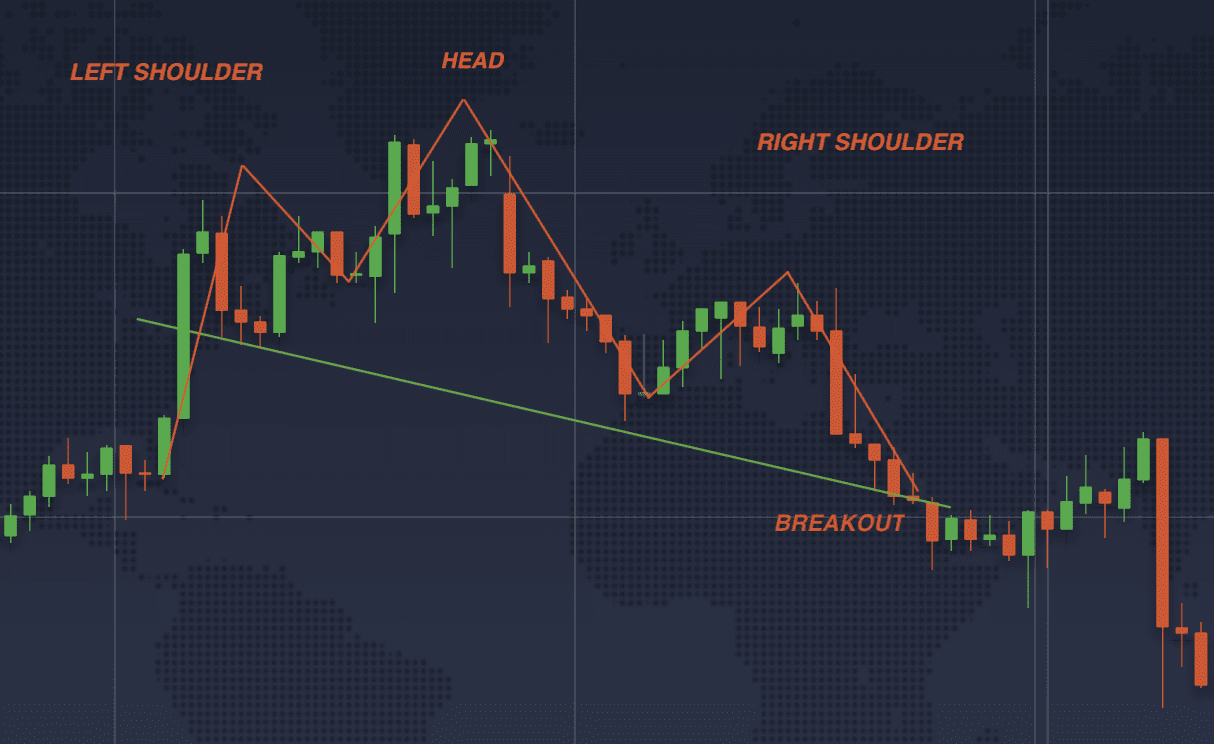
This pattern usually indicates that the current upward trend is losing momentum and a decline is to be expected in the near future. The neckline of the pattern is drawn by connecting the lows of the two shoulders. A breakout below the neckline is considered a confirmation of the pattern and an indication of a sell point.
How to spot the Head and Shoulders pattern:
- You may look for an asset in a bullish trend. After a while, the bullish trend starts to lose momentum and the price tests a new low. It bounces back, forming the left shoulder of the pattern.
- The price starts to rise again, forming the head.
- When the momentum proves to not be enough, the price drops again, and then makes one last attempt at bouncing upwards. This forms the right shoulder in the pattern.
- A “neckline” can be drawn by connecting the low points of the pattern. Once the price breaks through the neckline, the reversal of the trend is confirmed.
The Head and Shoulders pattern has its bullish version — the Head and Shoulders reversal. It looks the same, but inverted. The breakout above the support line may be an indication that the bearish trend is over and that a bullish indication is confirmed.
If you would like to watch a recording of our live webinar about chart pattern trading, check out the video below.
Doji
Doji is often used in chart pattern trading to spot indecision in the market. This type of a pattern is formed when the open and the close price are very close to each other, forming a very small or even nonexistent body of the candle.
While some traders believe that the Doji indicates a trend reversal in the market, it is not always the case. It is important to combine any single candlestick pattern, including the Doji, with other tools of technical analysis. Using technical indicators will help to confirm the indications and make an informed decision.
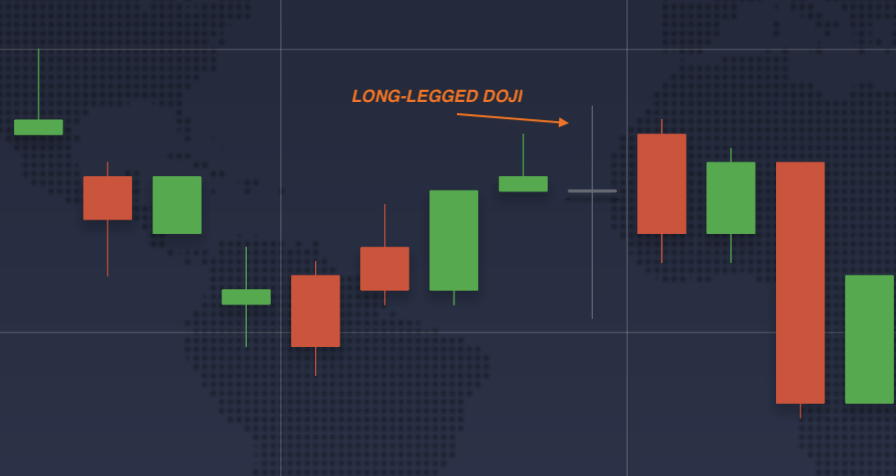
How to spot the Doji candlestick pattern:
There are several types of Doji to watch out for.
- Classic Doji: Open and close prices are the same or very close to each other.
- Long-legged Doji: The upper and lower shadows are long compared to the body.
- Gravestone Doji: The opening and closing prices are at or near the low of the trading period, creating a long upper shadow.
- Dragonfly Doji: The opening and closing prices are at or near the high of the trading period, creating a long lower shadow.
Harami Cross
The Harami Cross candlestick pattern is a two-candlestick pattern, consisting of a large candlestick followed by a Doji that is completely engulfed within the body of the previous candle.
Normally, the first candlestick is long, and it indicates a strong bullish or bearish trend. The second candlestick is a Doji, which indicates indecision or a potential reversal. Together they form a pattern that might show a change in the trader’s sentiment. A bullish pattern indicates that the price may soon reverse to the upside, while a bearish pattern indicates that the price might start falling soon.
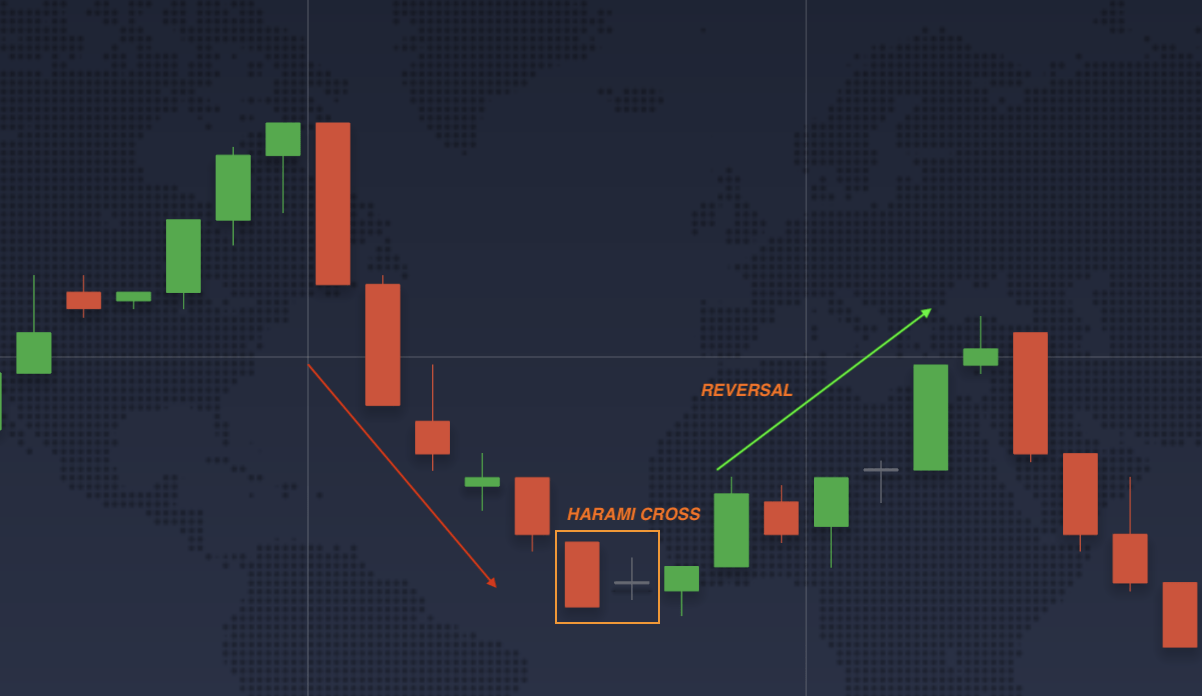
How to spot the Harami Cross candlestick pattern:
- The first candlestick that you may be looking for should be a long candlestick that indicates a strong trend.
- The following candlestick is a classic Doji, which is fully positioned within the previous candlestick’s body.
- The next candlestick confirms the reversal. If it is a bullish Harami Cross (red candlestick followed by Doji), the reversal will be to a bullish trend. If the pattern is bearish (green candlestick, followed by Doji), the reversal will be to the downside.
To sum up
Chart pattern trading is an approach that utilizes repetitions in candlestick patterns in order to attempt to predict the future movement of the asset. While patterns can be very useful, there is no single candlestick pattern that could provide completely accurate information every single time. Combining candlestick patterns with other analysis tools is an important step to ensure that you are better informed and have several sources of indications.
If you’d like to learn more about other candlestick patterns, check this article next: Trading with Candlestick Patterns.
