
Bollinger Bands indicator is a popular and useful tool, but it can be a bit confusing if applied incorrectly. In this article, we will explore the different ways Bollinger Bands may be used in trading*.
A Sword That Cuts Both Ways
Bollinger Bands are three lines that envelope the asset price chart. The central line is a standard SMA, while the other two are plotted as two standard deviations, positive and negative, around the SMA.
Have you ever heard the saying about a double-edged sword that cuts both ways? It can be applied to a lot of different things, but the general meaning is doing something and expecting a certain outcome while also risking the opposite effect.
When it comes to Bollinger Bands, it might be appropriate to caution traders to take it slow. Since this indicator is very versatile, it is important to focus on one use of the tool at a time. There is a wide range of uses and trading approaches it can be applied to, and that range makes it very possible to get mixed and/or conflicting indications.
This is a quick look at three (3) basic applications of Bollinger Bands trading approaches that may be useful for short-term traders on the IQ Option platform.
Support and Resistance
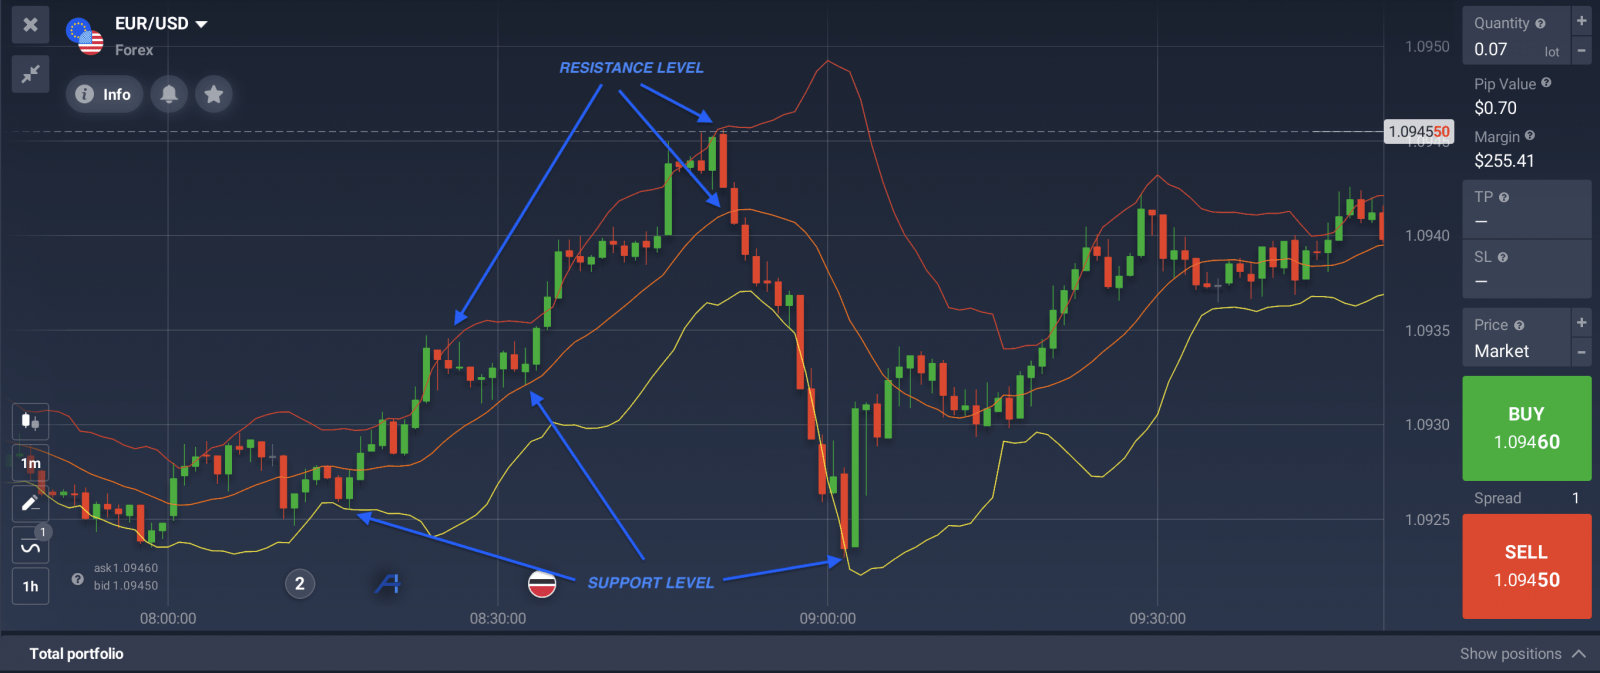
Bollinger Bands is a suitable indicator for finding and confirming support and resistance. The bands provide dynamic support and resistance levels, which change with the market conditions.
When the market is calm, the lines move closer together because prices are hovering near a point of equilibrium between buyers and sellers. When the market is active, the lines move farther apart because prices are volatile and support/resistance zones are shifting. Volatility is an undeniable part of trading*, so it’s important to know how to read it.
Regardless of their width, bollinger bands may be used as targets for entries and exits for a trend-following approach. If prices are trending higher, touches to the lower boundary and the midline may be used as trend-following support entries. Meanwhile, if they are trending lower, touches to the upper boundary and the midline may be used as trend-following resistance entries.
Multiple Time Frame Analysis
The multiple time frame approach uses a longer time frame to determine trend and a shorter time frame to get indications. Bollinger Bands work well in any time frame and are well suited to this type of analysis. This technique allows traders to assess the price chart on several levels and get a grasp of the market movement as a whole.
You may use Bollinger Bands indicator on a daily chart to get entries on an hourly chart or use an hourly chart to get indications for a 10, 5, or 1-minute chart. The essence of this approach is to start with a larger time frame, and upon checking it, move down to a smaller time frame chart and assess the situation at that level.
If, on the longer time frame chart, the price is bouncing up from the lower indication line, or up from the midline, then bullish entries may be considered on the lower time frame. If, on the longer time frame, the price is moving down from the upper indication line, or down from the midline, then bearish entries on the shorter-term chart may be considered.
Signal Line Breaks
Bollinger Bands are best thought of as trading ranges — dynamic highly elastic trading ranges — that give indications in the same manner. When prices are ranging or range bound, they will move up from support and down from resistance as in the support and resistance approach described above.
If, however, prices break through a signal line they may give a stronger indication. The caveat is that it must be a firm break of the signal line, not to confuse it with a test of resistance.
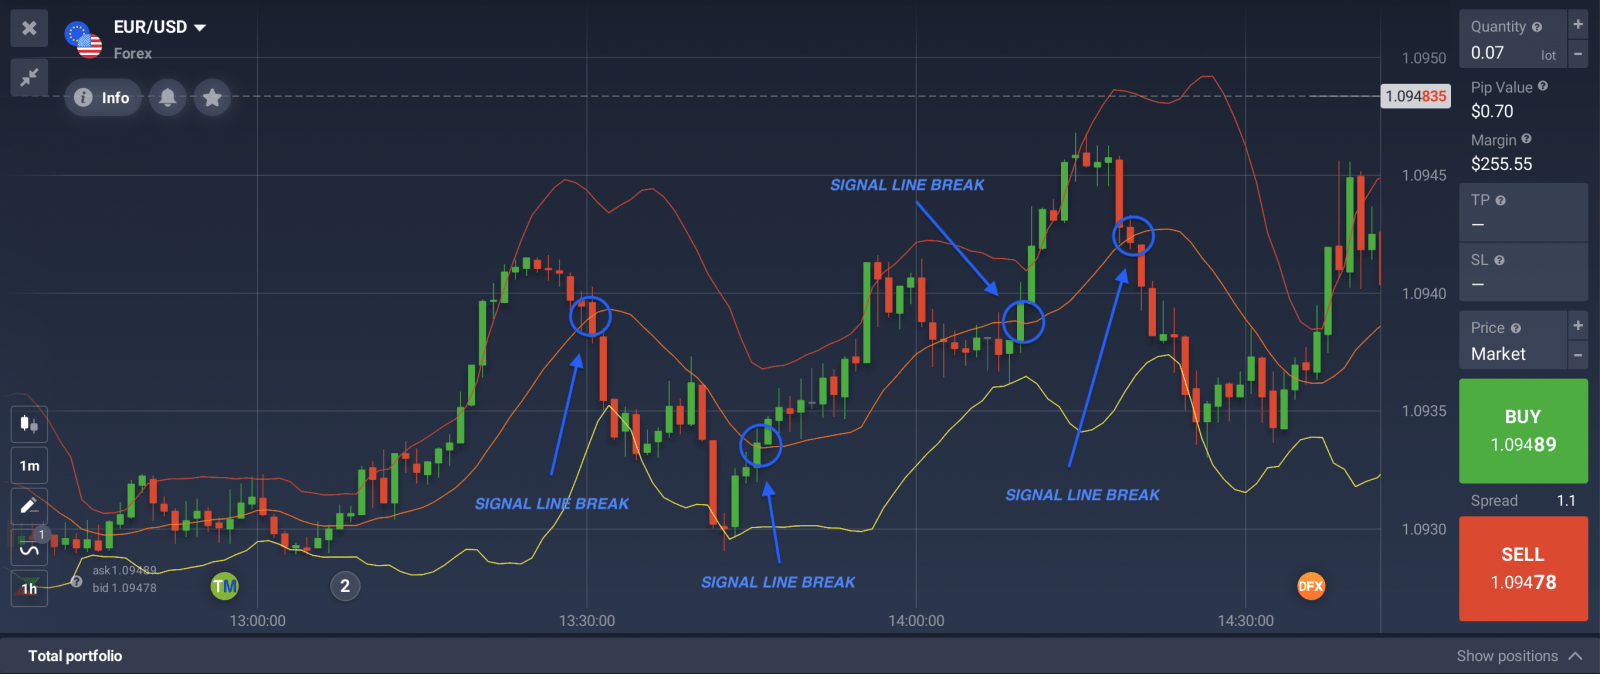
A break of the line, either the top or bottom or the midline, is an indication of changing market sentiment and constitutes a breakout. Prices can be expected to continue in the direction of the breakout, or, if they fall back from that point, to retest the break point for support/resistance.
The midline does count in this technique as it will often provide support/resistance as well. A break to the upside is bullish, especially if found within an up-trending market, a break to the downside is bearish and strong when found in a down-trending market. The chart in the example above shows two bullish and two bearish trend-following line breaks that all result in at least one more candle of further upside or downside.
It is necessary to remember that none of the above-mentioned methods can guarantee 100% accuracy or favorable results every time. Each approach has its risks, which need to be accounted for before entering into a trade.
Have you traded with Bollinger Bands? If not, you may consider starting with one of the techniques mentioned above. Use your demo account to get a feel for it, and see if one of these approaches suits your trading style.
*The IQ Option platform offers CFD trading only.
